 New Features in Version 9.0
Free Trial
The latest version is featured here: Version 10 Enhancements
Highlights
Sentinel Visualizer Version 9 offers many fabulous, new features to remain the best value of any link analysis software package.
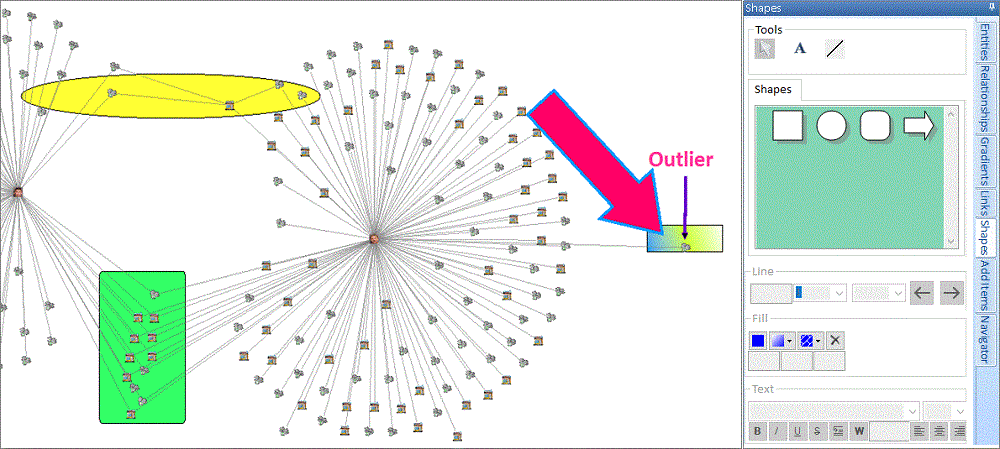
Add Text, Lines, Boxes and Arrows to Visualizer Diagrams
Annotate your diagram with shapes: text, lines, rectangles, circles, arrows, etc. with a variety of color, size, and font options.
Many new layouts are available to place your entities in geometric shapes and sort them based on the selected entity gradient value.
Circular Layout
Circular Spiral
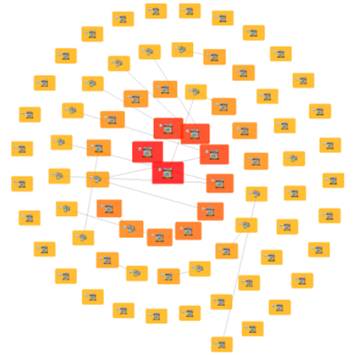 Entities sorted from the center growing in a spiral
Circular Concentric
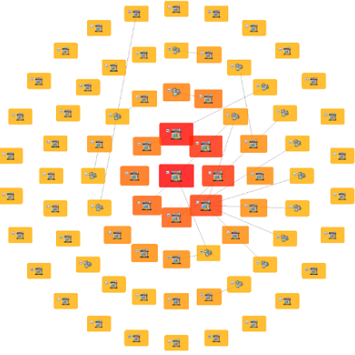 Entities placed in circles from the center out
Circle with Center
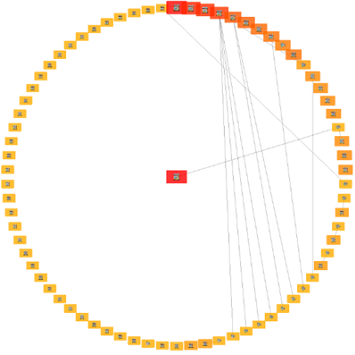 One big circle with the first entity in the center
One Circle
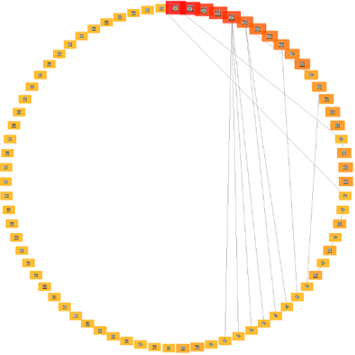 All the entities in one big circle
Elliptical Layout
Elliptical Spiral
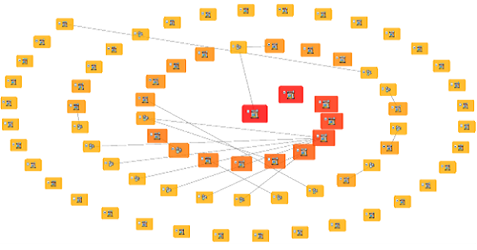 Entities sorted from the center growing in a spiral
Elliptical Concentric
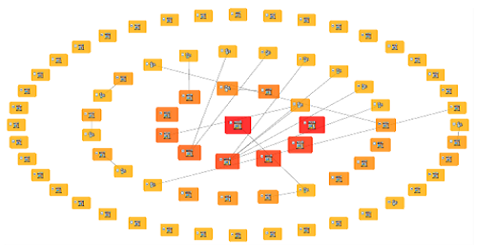 Entities placed in ellipses from the center out
Ellipse with Center
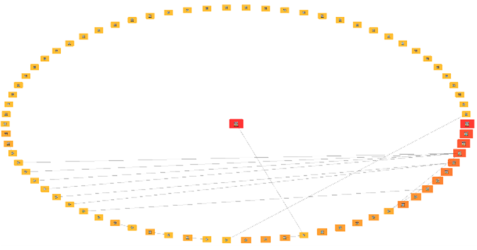 One big ellipse with the first entity in the center
One Ellipse
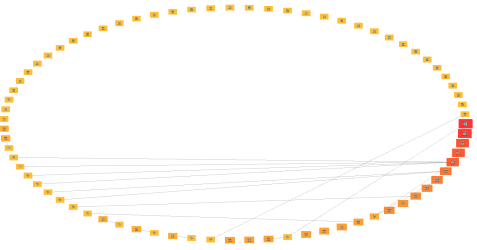 All the entities in one big ellipse
Rectangular Layout
Filled Rectangle
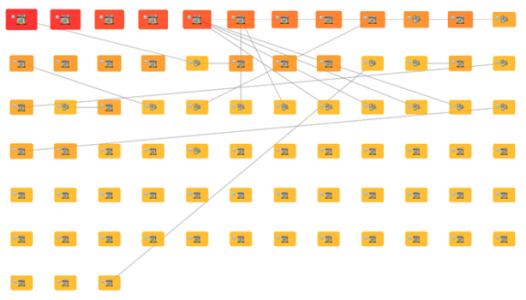 Entities in a rectangle filling the window
Rectangular with Center
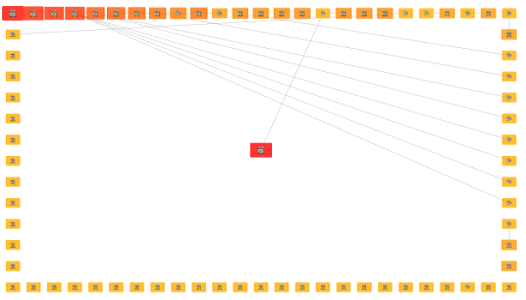 One big rectangle with the first entity in the center
One Rectangle
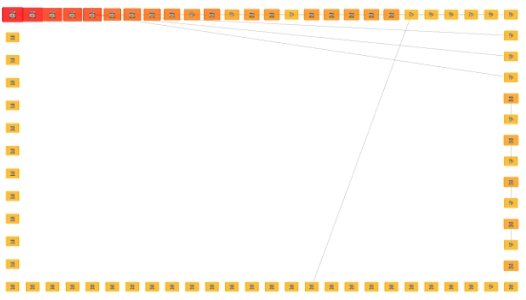 All the entities in one big rectangle
Square Layout
Filled Square
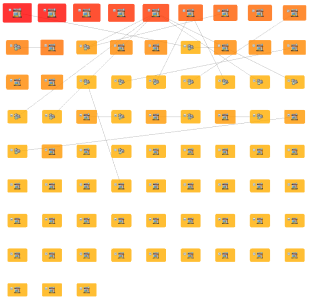 Entities in a rectangle filling the window
Square with Center
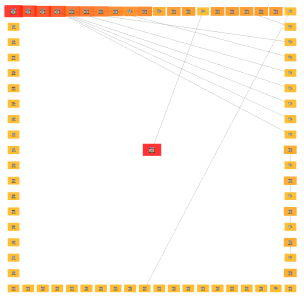 One big square with the first entity in the center
One Square
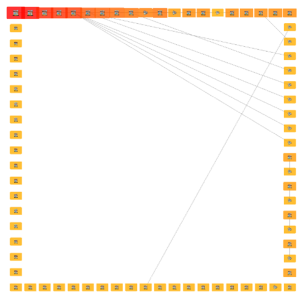 All the entities in one big square
Triangular Layout
Filled Triangle
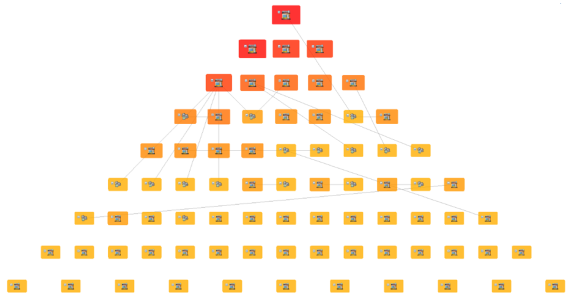 Entities in a triangle filling the window
Triangle with Center
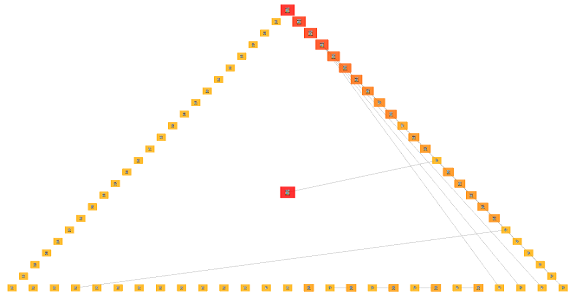 One big triangle with the first entity in the center
One Triangle
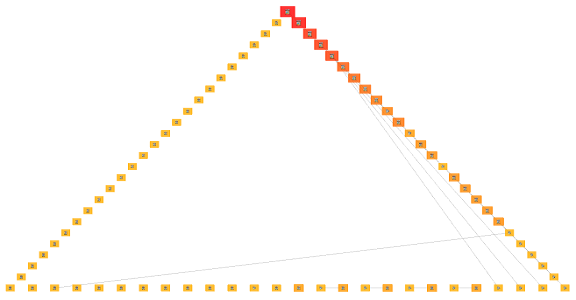 All the entities in one big triangle
With one click, you can now put all your entities and relationships on a new Visualizer diagram. You can also set the default layout to one of the new Geometric styles.
Panel on Home Page

Visualizer Option on Top Menu
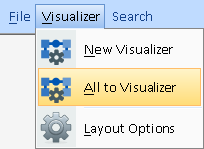 Also includes a quick way to set Layout Options
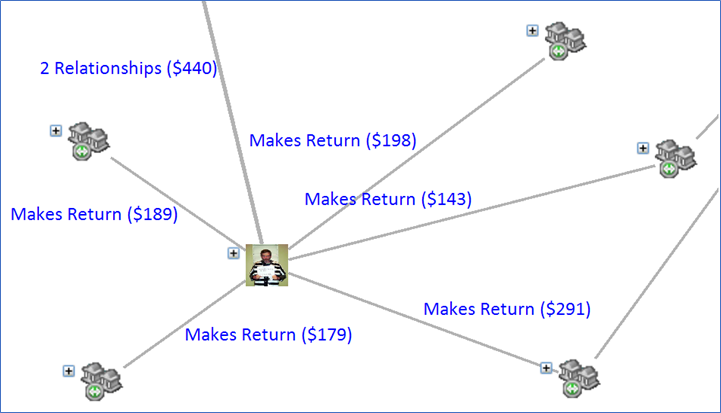
There is a new option to show the sum of values on the line for all the relationships between two entities with numeric formatting options.
Entity Search
The entity search form is redesigned to be more powerful and easier to use. When the form appears, the list of last selected entities appears to eliminate the need to search for your most common entities. There are options to select and send it to Visualizer, view its details, and export it to Excel.
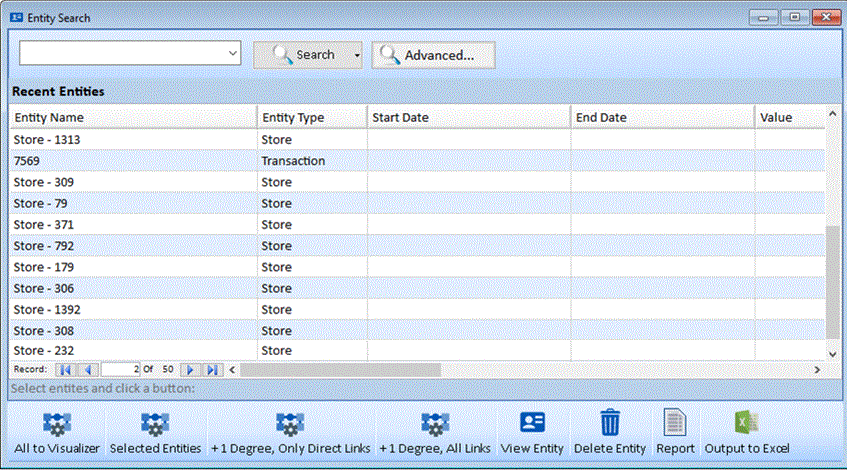 Entity Search Form with more recently selected Entities.
The relationship search form is similarly redesigned to show the more recently selected relationships.
Document Content Search


 Sentinel Visualizer includes a searchable document repository!
Each Entity and Relationship can have an unlimited number of documents associated with them. If the documents are embedded (rather than linked), Sentinel Visualizer supports searching its text contents. Your documents can be a wide variety of formats such as Microsoft Excel spreadsheets, Microsoft Word documents, PDF files, HTML, etc.
Under Advanced on Entity Search and Relationship Search, or in the Advanced Dataset Builder, enter the text to search under Doc. Content.

This retrieves the list of entities or relationships with at least one document that contains your search text. In the Advanced Dataset Builder, the results also list the specific documents.
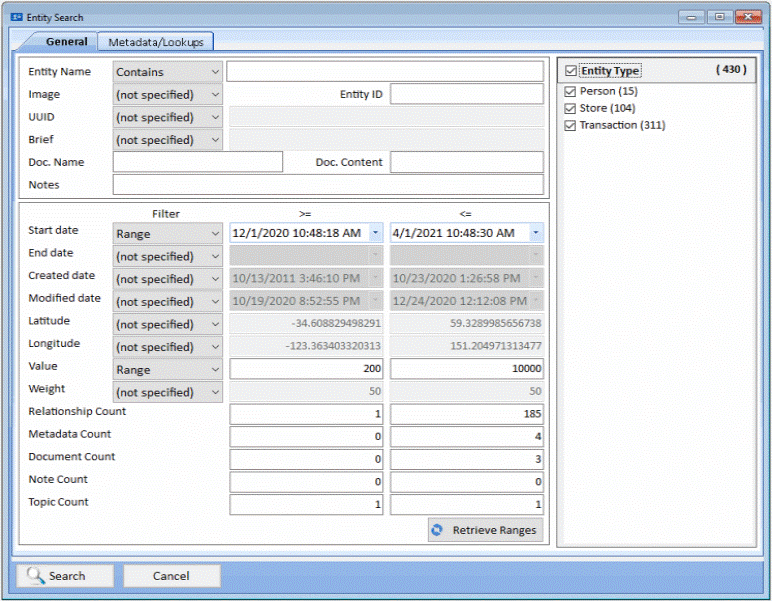
Advanced Entity Search
The advanced entity search provides the ability to search many more fields for specific values, numeric and date ranges, blank or not blank, and even document text contents.
Advanced Relationship Search
The advanced relationship search provides the ability to search many more fields for specific values, numeric and date ranges, blank or not blank, and even document text contents.
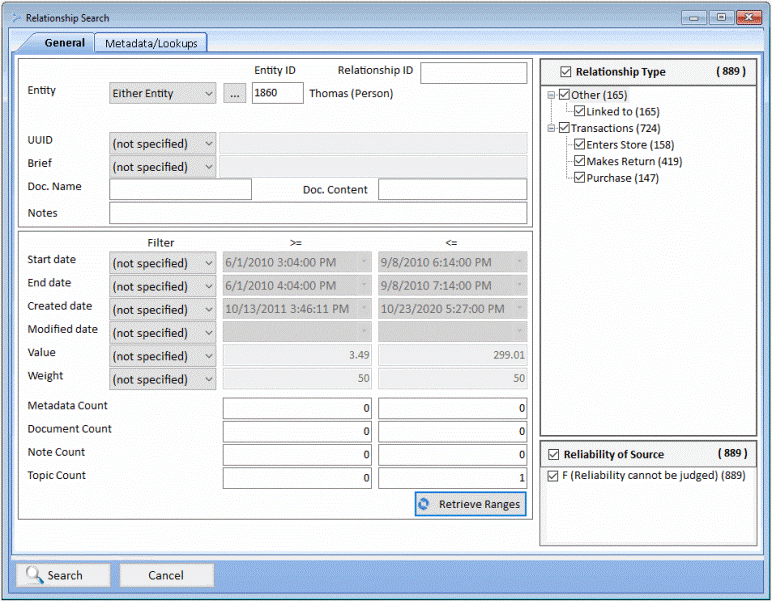
The new Retrieve Ranges button inserts the minimum and maximum values for the numeric and date fields based on all the data in your database. If you run this from the Data Refinement feature in the Visualizer Diagram, it retrieves the values for the data in the diagram. A great way to quickly understand your dataset.
The new Dataset Builder simplifies the selection of entities and relationships for the Visualizer with increasing refinement.
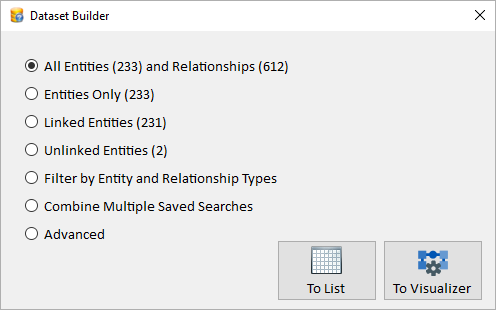 Dataset Builder Form
The number of entities and relationships for each option are shown in parenthesis. Selecting any of the first 4 options sends the data to the Visualizer diagram.
- All Entities and Relationships: Send all the data to the Visualizer.
- Entities Only: Send all the entities without sending any relationship lines to the Visualizer.
- Linked Entities: Only send entities that have relationships linking them to other entities and display the entities and relationship lines.
- Unlinked Entities: Only send entities that have no relationships with other entities.
- Filter by Entity and Relationship Types: Easily select the types to include and exclude.
The new Advanced Dataset Builder is a Wizard with separate pages for detailed selection of entities and relationships, and previewing the results. It illustrates the 15 types of connection options to better understand the filter and connection combinations.
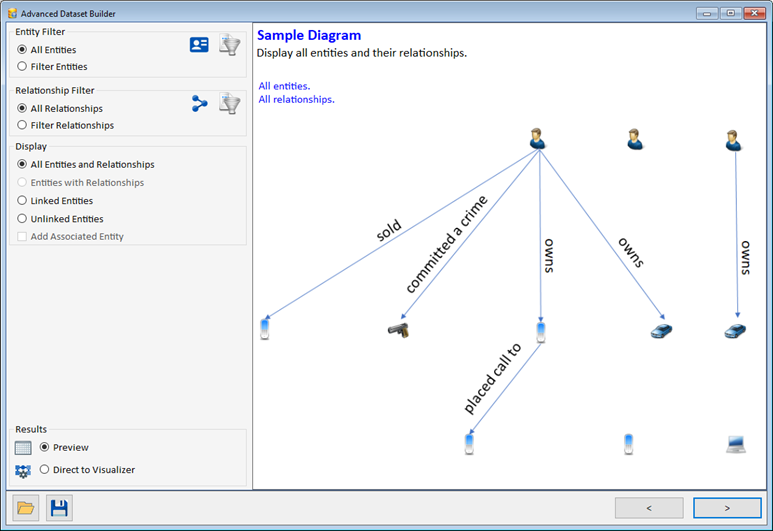 First Page of the Advanced Dataset Builder Wizard
Get Links adds entities and relationships to the diagram for the selected entities. When new entities are added to the diagram, they are added with links to all other entities on the diagram. You can specify the number of degrees from the menu or specify the number for the new Custom Degrees feature.
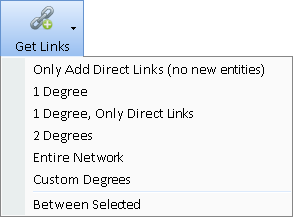
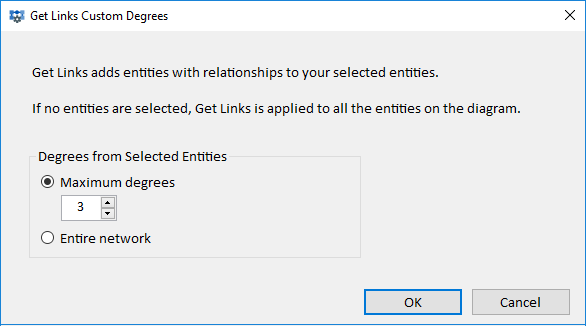
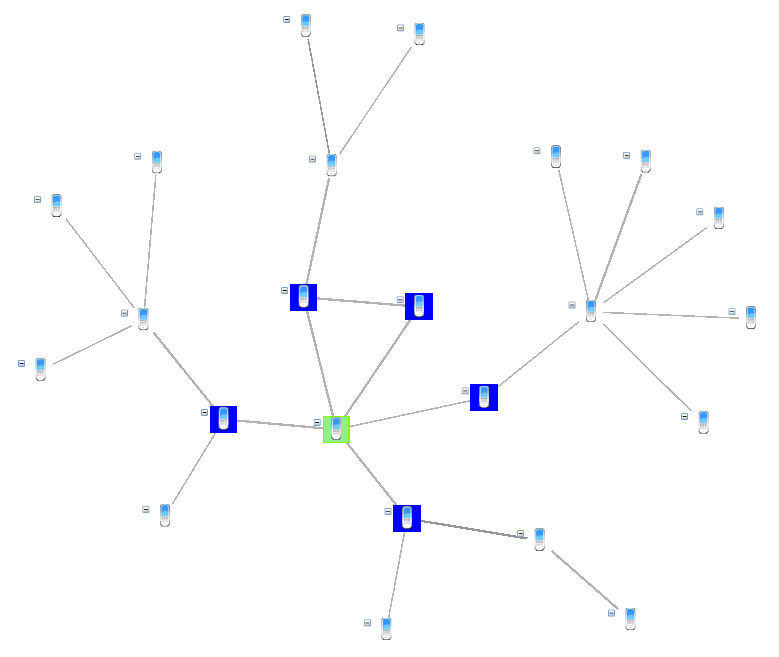
From One Entity to Its Entire Network
This new option gets all the entities linked to your selected entity or entities. This adds all the entities in the network without guessing how many degrees it has.
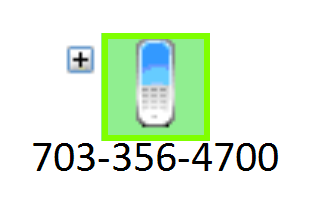
Start with One Entity
Get Links One Degree
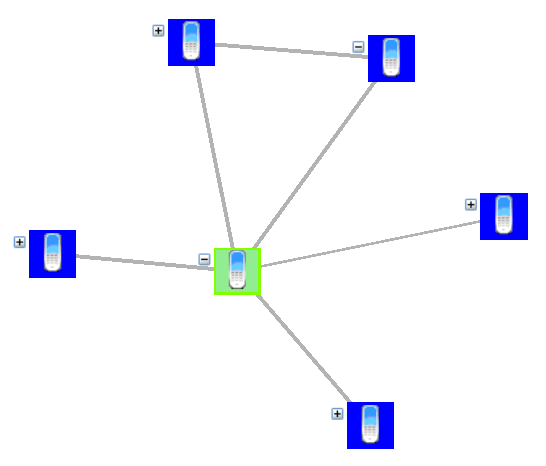 Includes links between links
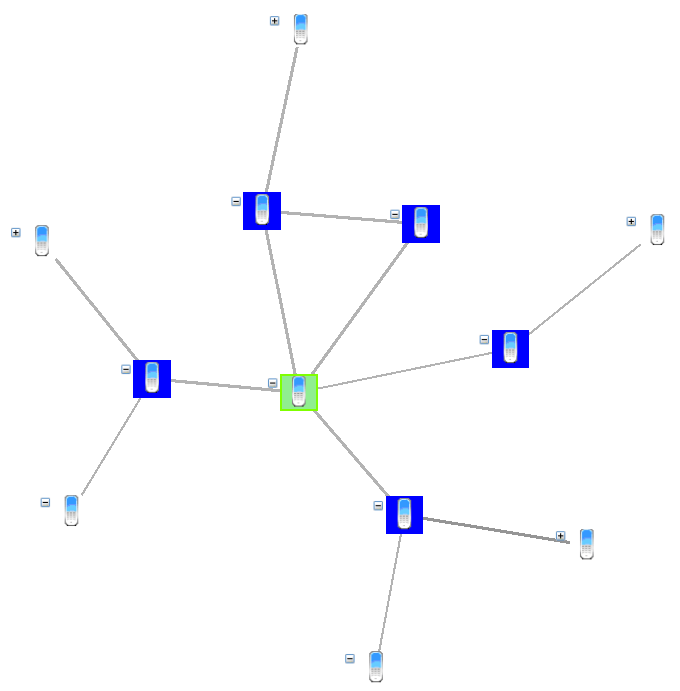
Get Links Two Degrees
Get Links Entire Network
Between Selected
This new and extremely powerful feature adds the fewest entities among your selected entities to find the smallest network among them.
For example, for Contact Tracing, three students tested positive. Between Selected quickly finds the shortest path between them.
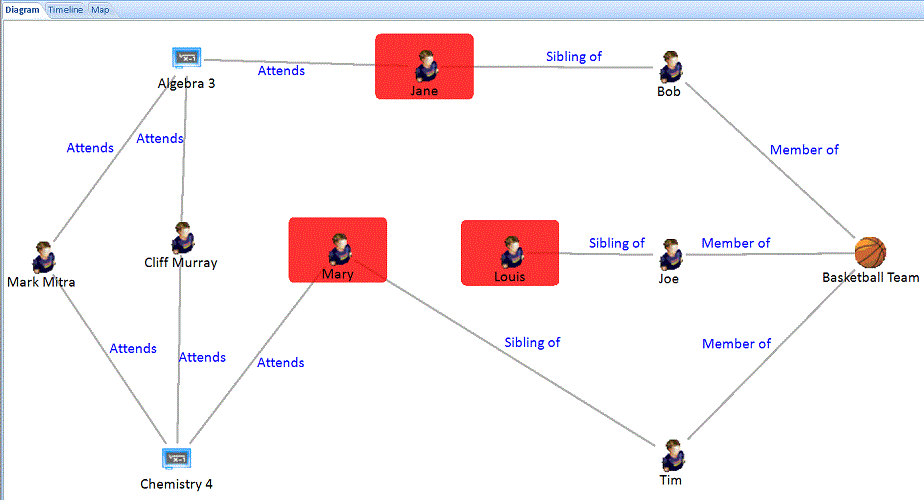 The infected all have siblings on the Basketball Team! Get them tested!
Combined with Data Refinement
Data Refinement lets you filter the type of Entities and Relationships on your diagram.
If you have data refinement turned on, Get Links now respects those settings and only retrieves the entities and relationships that pass those filters. Easily focus on the data you want without retrieving the data you want to exclude.
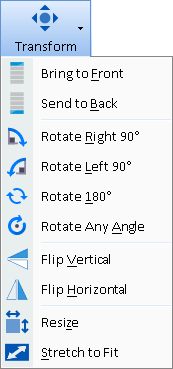
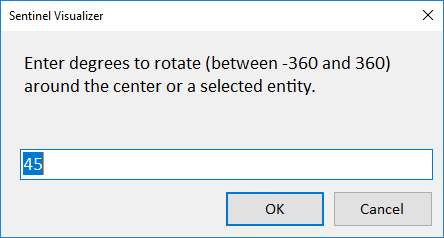
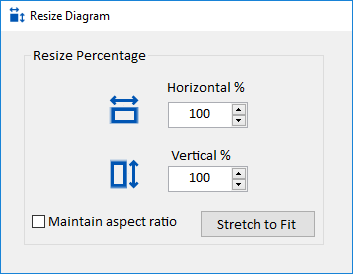
The new Transform button allows you to modify your diagram without redrawing it. Rotate the entire diagram, and flip it horizontally or vertically. Resize (stretch) it, including Stretch to Fit to maximize it to your current screen dimensions.
The panels on the right side of the Visualizer are reorganized and improved. Here are some of the new features on the Entities, Gradients, and Links panels.
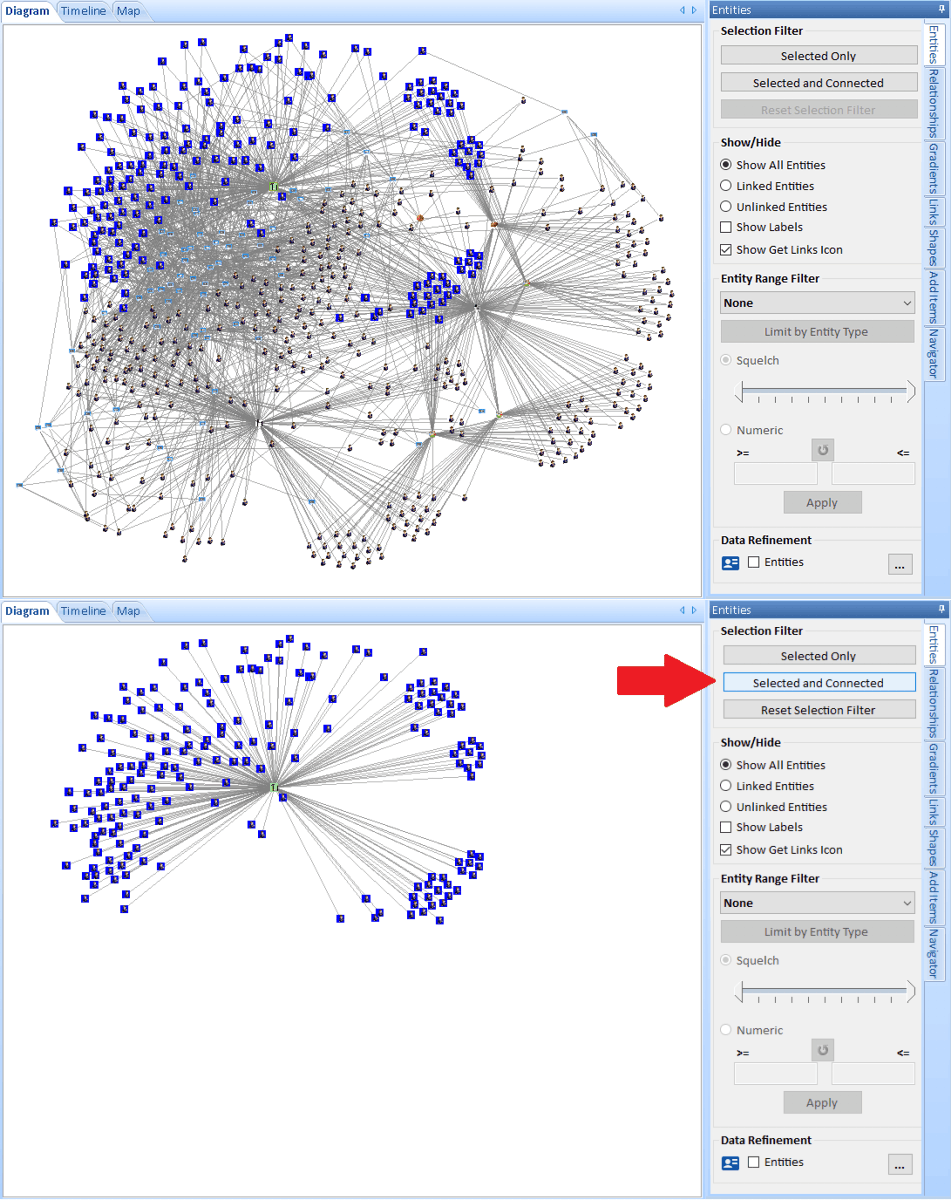
Entities Panel
The Entities panel makes it easy to just show the selected entities with or without their connected entities. Quickly show all the linked and unlinked entities. Filter on numeric ranges and perform detailed refinement on all the Entity fields.
Gradients Panel
Color and size your entities based on a variety of metrics. This lets you see the relative value between your entities.
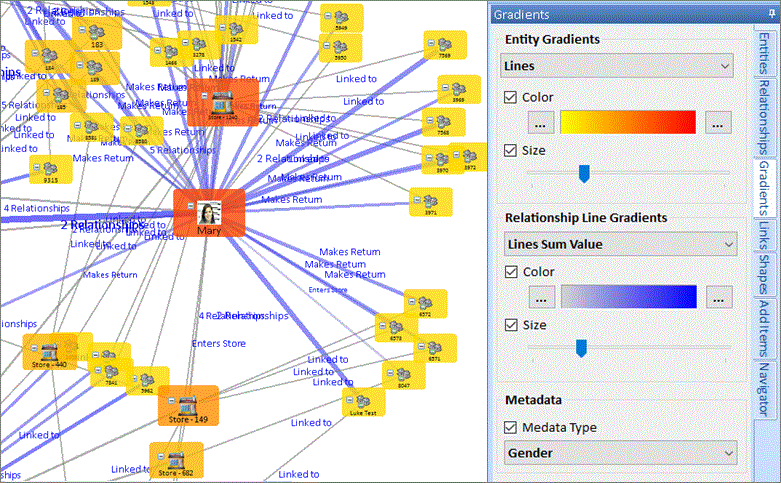
Gradient colors and size can now be applied to Entities and Relationship Lines separately.
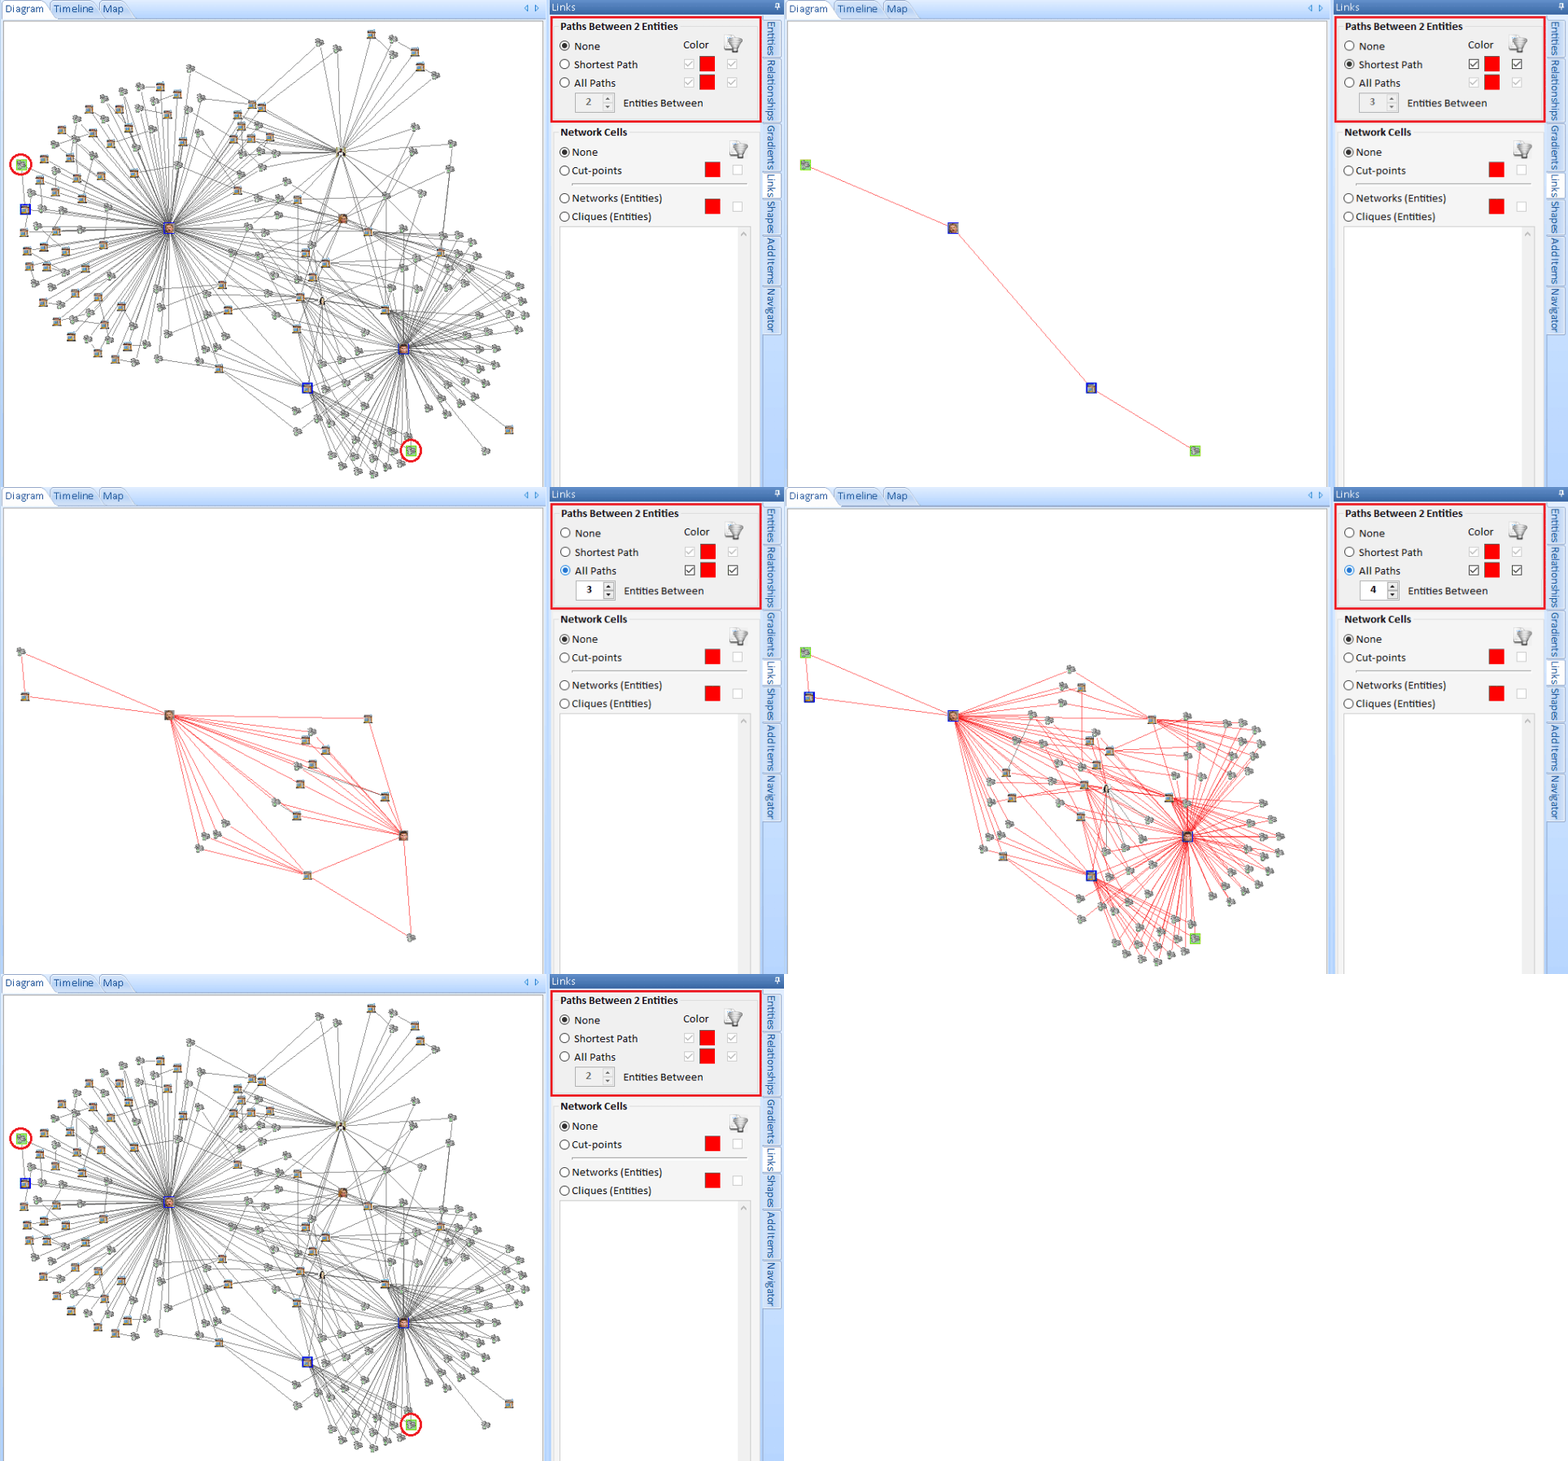
Links Panel with Shortest Path Analysis
The Links Panel provides tools that aid in the connection between entities. Shortest Paths can now be filtered, and All Paths can be controlled by the number of entities between your selected entities.
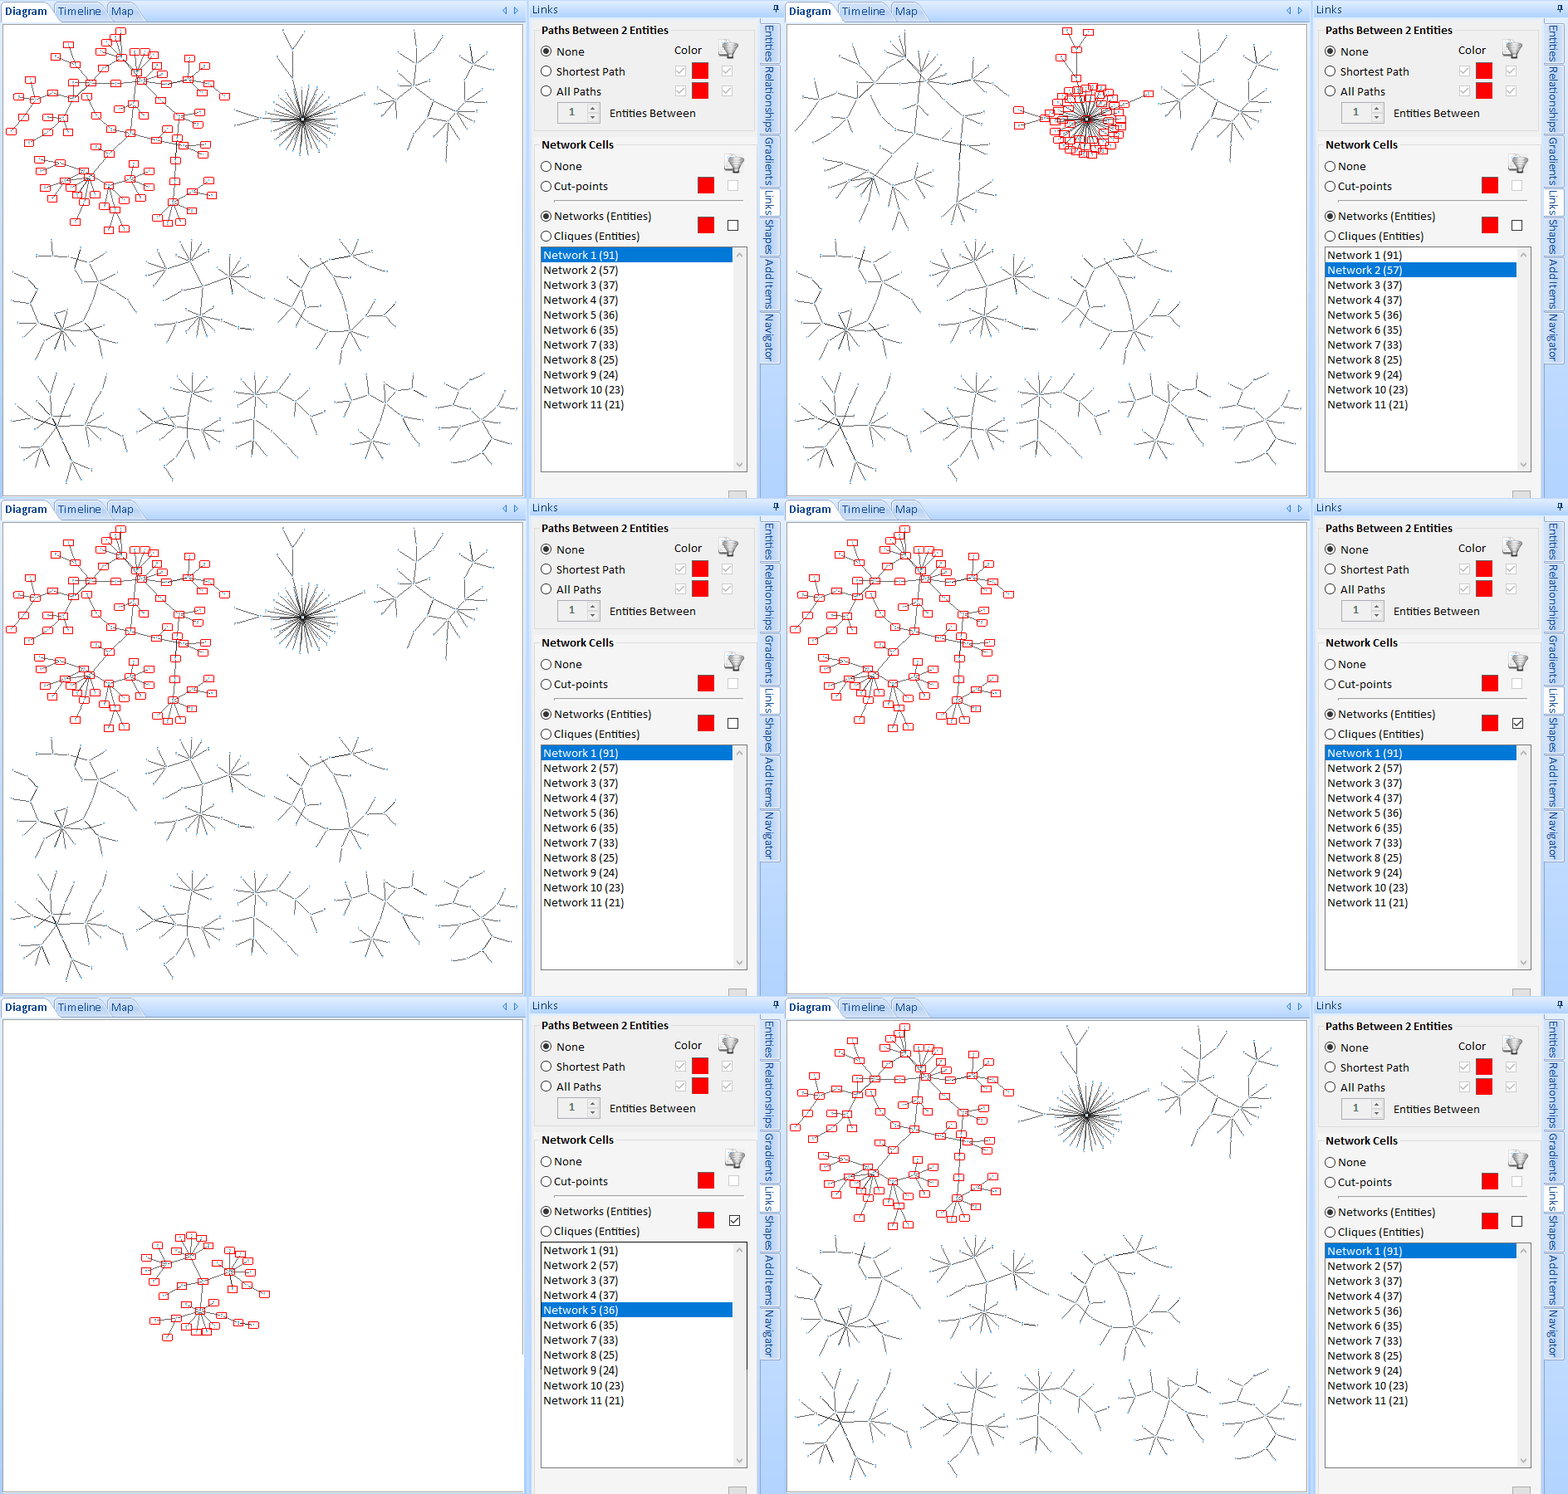
Links Panel with Filterable Network List
The Networks option displays a list of disconnected networks on your diagram with their entity count. As you click on each item, the diagram highlights the members of that network. Check the filter button to only show the selected network's entities.
Diagrams can be saved to your database and retrieved later. When a saved diagram is opened on an existing diagram, you now have the option to merge it.

The merged diagram is placed to the right of your existing diagram. Easily combine multiple diagrams and separate analysis into one.
Multi-level Undo and Redo are now available to reset the addition or removal of entities, relationships, shapes, layouts, transformations, and other significant changes to the diagram.

Never worry about making a mistake as you analyze your data visualization.
The import wizard is easier to use and catches common mistakes such as warning when the import entity and relationships do not exist in current database. It no longer defaults to the previous entity and relationship types, so you specifically select it.
The user interface is improved with the toolbar icons enlarged and more modern; New is renamed to Clear, and tabs in the bottom section are moved above it.
A database checkpoint is automatically created before each import to easily restore (rollback) your data if you don't like your import.
The 3-D Viewer displays your link chart in 3-D that you can rotate, animate and zoom in and out of. You can even use 3-D glasses to visualize your network.
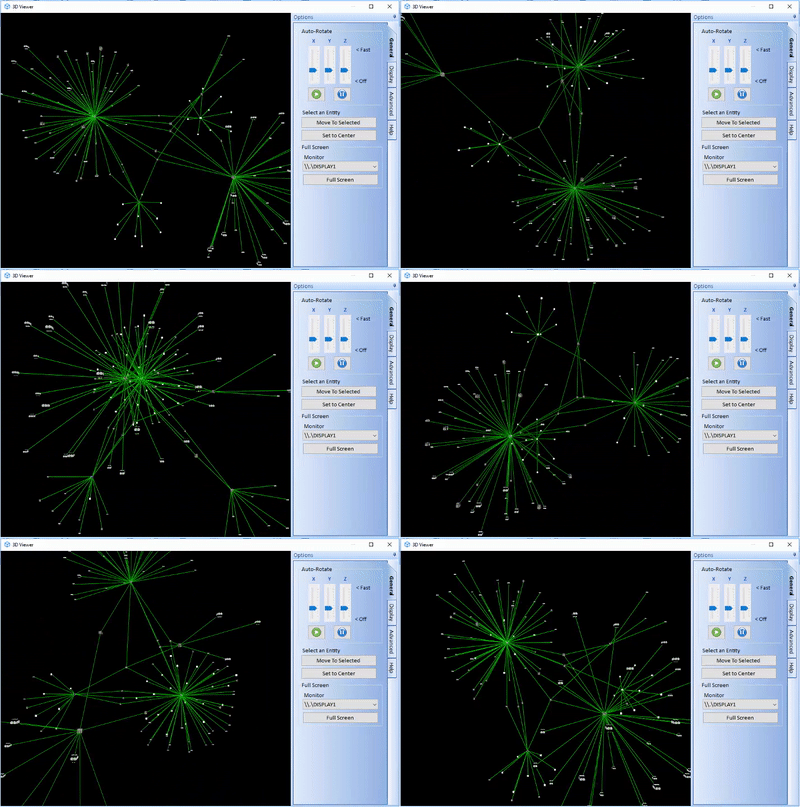
The panels are reorganized into tabs and rearranged for ease of use and localization. The General tab has more common items on top with icons for play and pause, and improved adjustment of Anaglyph options. Less important items moved to the Other tab.
Export/Import Lookup Tables Between Databases
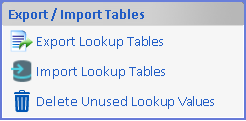 All the values in your lookup tables can be exported to a Sentinel Visualizer Lookup file (*.SVL) that can be imported by another database.
This is a quick way to update the lookup values across databases or create new databases with a custom set of lookup values.
Delete Unused Lookup Values
Easily delete all the lookup values in the current database that are not used.
A database checkpoint is automatically created before you import or delete your lookup values, so you can easily undo it.
Newest Version
Previous Versions
- New features added in Version 8
- New features added in Version 7
- New features added in Version 6
- New features added in Version 5
