 New Features in Version 10
Free Trial
Sentinel Visualizer Version 10 is a significant update from Version 9 with many enhancements.
Import Enhancements
Visualizer Enhancements
- New Online Maps from Microsoft Bing Maps
- Custom Entity and Relationship Properties and Labels
- New Entity Replace
- New Directional Get Links
- Layout: New Group by Entity Types
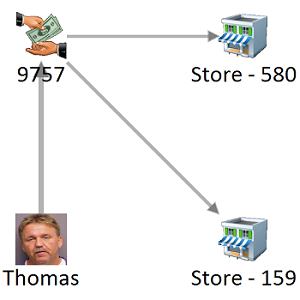
- New Curved Relationship Lines
- Timeline Enhancements
- Limit Entity Types to Database
- Refresh and Panels Buttons
- Social Network Analysis Entity Limit Removed
Search Enhancements
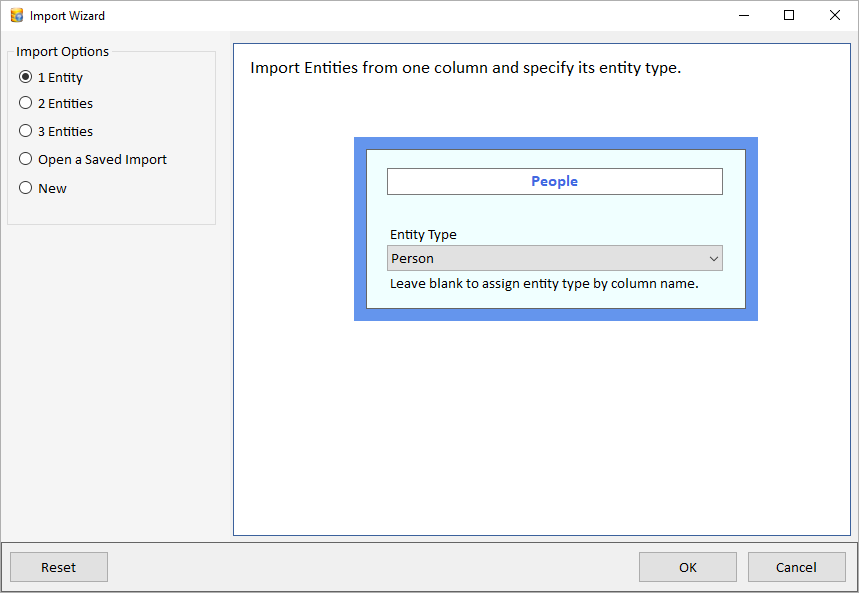
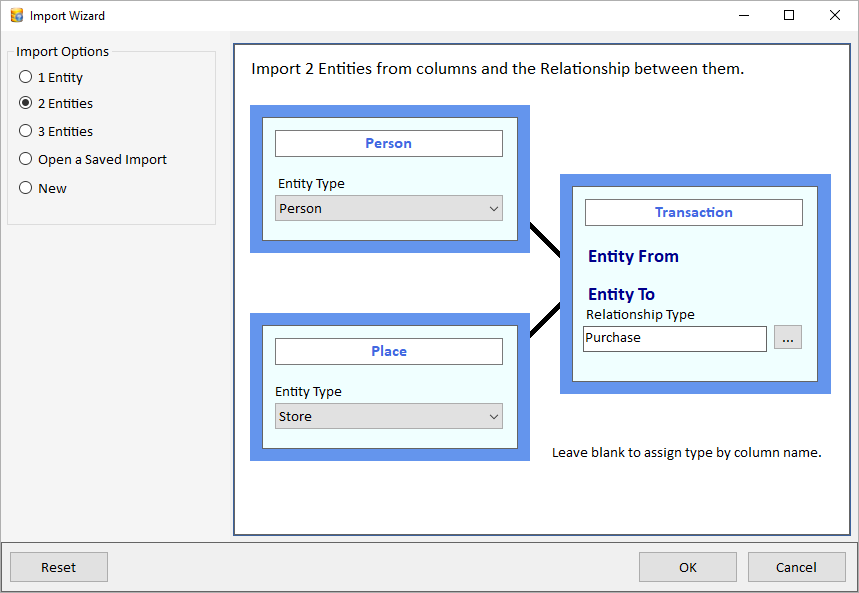
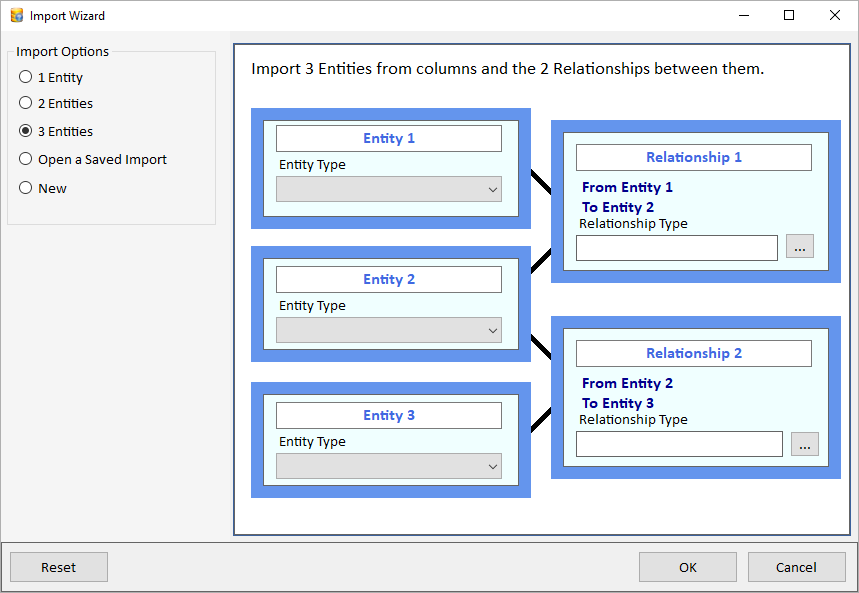
The new Import Wizard simplifies creating an import for one entity, two entities and a relationship, and three entities and two relationships:
Import adds many new features with faster performance.
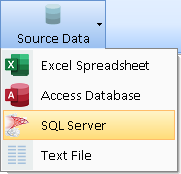 Import SQL Server Data
Import data directly from a SQL Server database by choosing among its tables and views.
The SQL Server and Access database dialogs have options to list only tables, only queries/views, or both for your selection.
WHERE clause to Limit Source Data
Apply an optional WHERE clause on your Source Data (Excel, Access, SQL Server, and Text files) to limit the records to import.
The WHERE clause can be exact matches on values, ranges, and even wildcard matching using the LIKE statement. This simplifies the process of designing different imports for subsets of your Source Data. It eliminates the previous need to create separate copies of your import file with different records.
Import Additional Columns
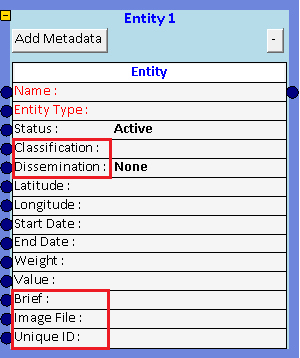
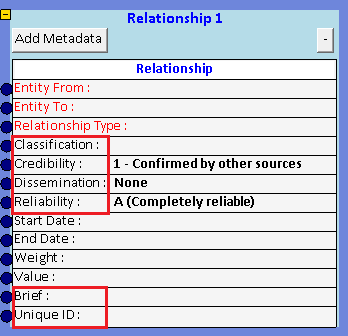
All the Entity and Relationship level columns can now be imported by assigning a source data column to them or specifying a value.
5 More Entity Columns
6 More Relationship Columns
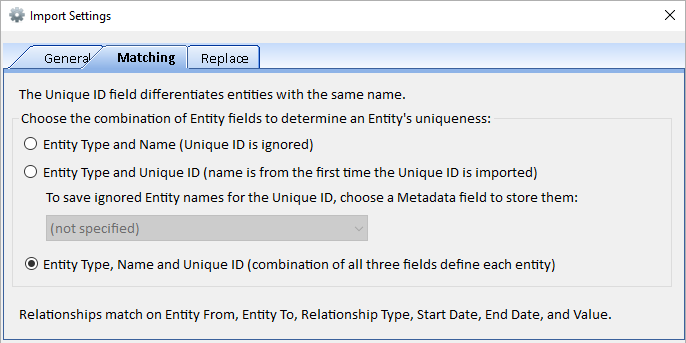
Use Unique IDs to Support Duplicate Entity Names
Choose among 3 options for the columns that define a unique entity. This let you have entities with the same name differentiated by their Unique ID field.
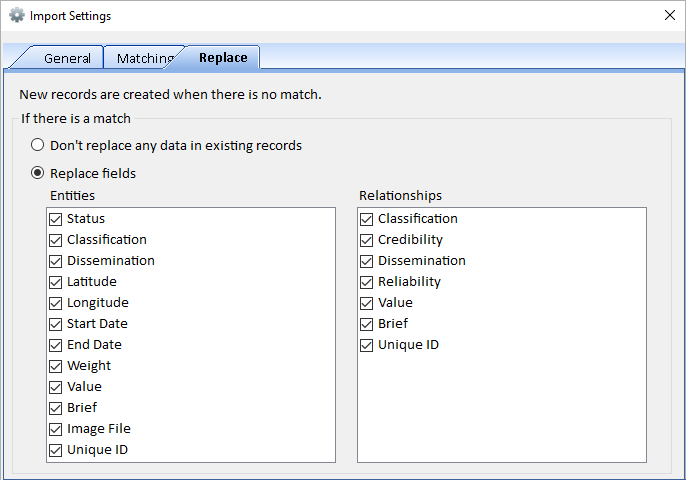
Choose which Columns to Update
If an imported entity or relationship exists in the database, the Import Settings let you control if the existing records are updated and if so, which columns.
Assign Values Directly to Columns
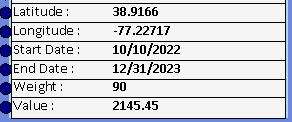
In addition to assigning a column based on a field from the Source Data, you can now assign a value directly for all your imported records:
When Source Data Changes, Column Assignments are Preserved
When updating an existing source data, the new one may have different columns from the current one. Previously, all the columns needed to match to preserve assignments. Now, assignments for matching columns are preserved and only unmatched ones deleted.
 New Saved Import File Format Includes Source Data
Import files are saved in a new encrypted format (*.SVIX) with source data specifications to offer the option to load the data when opened. It also has improved support for localized versions.
 Open Import Files with MRU List and Options to Load Source Data
When opening a saved import file, a new form shows the most recently used (MRU) list of previously opened files for quick selection.
If the SVIX file has a Source Data, a prompt asks to load it. If it has lookup values that don’t exist in the database, a list of the missing values is shown with a prompt to add them to the lookup lists.
Opening an import file to repeat previous imports is much easier now even if the Source Data columns changed.
 Preview Data Before Import
Preview entity and relationship import records (first 500) before importing it. Quickly ensure your column assignments are correct before updating your database.
New Toolbar Buttons
Undo and Redo

Undo and redo your changes.
Edit Source Data

Change the data options such as its WHERE clause or database table.
Refresh Lookup Lists

If lookup data changes, update the lookup lists in the entity and relationship boxes.
Line Options
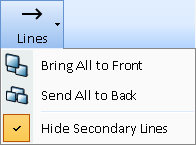
Line options to move all lines to the front or back, and hide secondary column assignments to declutter complex imports.
User Interface Enhancements
Required Columns are Red
Required columns are red; assigned values are bold.
 Required columns are red until they are assigned a source data column
New Box Placements and Appearance
- Adding a relationship box automatically adds two entity boxes with the relationship.
- New entity and relationship boxes are placed in empty spots and not over existing boxes.
- Box widths are resizable including the metadata grid.
- Boxes are more opaque.
Line and Port Enhancements
- Thicker lines and arrows to simplify assignments and selections.
- Larger ports moved to the edge of the boxes.
- Lines between boxes are cleaner by eliminating labels on lines.
Collapsible Boxes for Reduced Heights
Entity and relationship boxes can be collapsed to reduce clutter. Shrink their heights to their last assigned column.
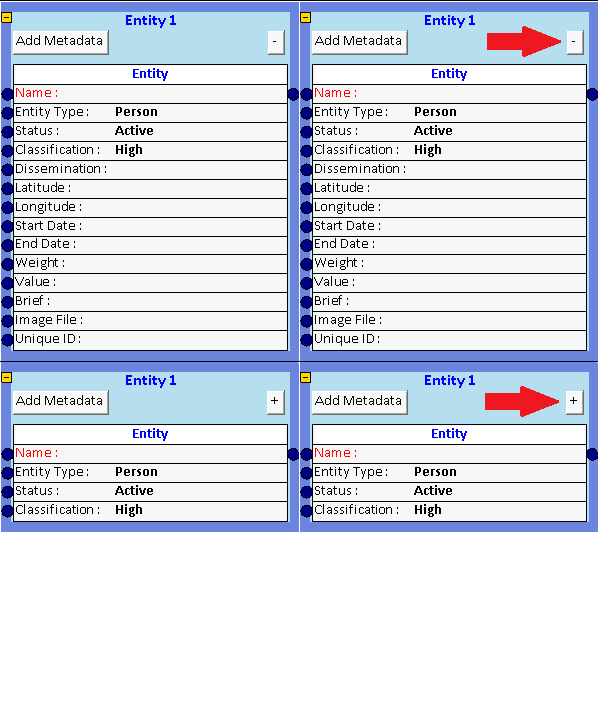 Click [-] to minimize the box and [+] to restore it
Visualizer Enhancements
Entities with latitude and longitude can be plotted on the Visualizer map. With an Internet connection, online maps from Microsoft Bing offer high resolution topography and road styles for any part of the world.
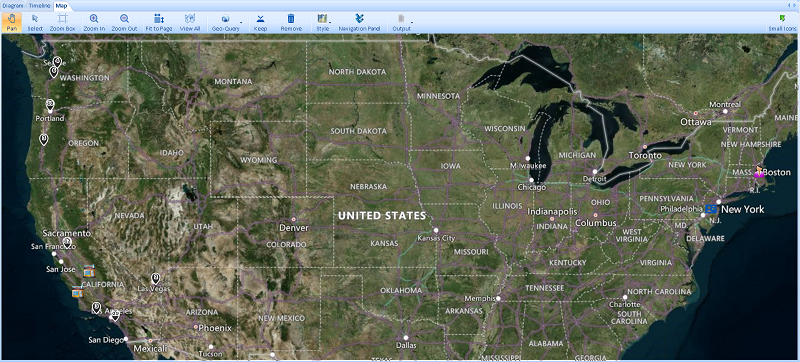 Online Map Hybrid Style (Borders and Topography)
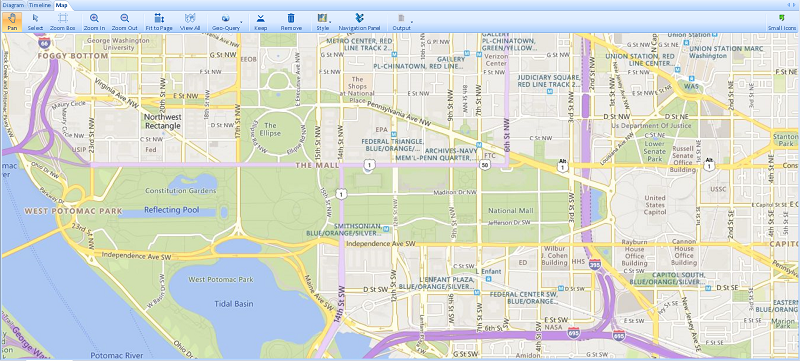 Road Style
- Zoom in and out of your map.
- Fit to Page automatically adjusts the map to show all your mapped items.
- Perform Geo-Query in a circle or rectangle to add entities in that region.
- Offline maps are still supported including the use of shape files.
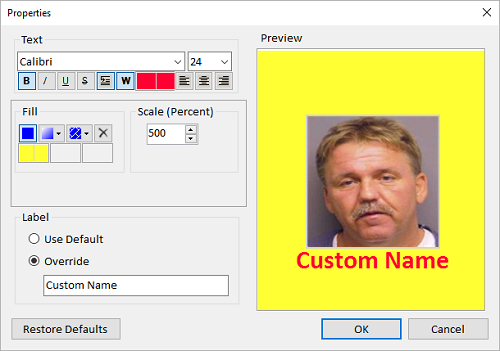
On the Visualizer, Entity and Relationship lines can be customized individually or by type with different fonts, colors, size, line widths, etc. Labels can also be customized to display information like Metadata value, metrics, dates, etc. Custom properties can also be saved.
|
Entity Properties
|
Relationship Properties
|
Custom Labels
By default, Entity Labels show the Entity Name. In version 10, other values such as Entity Type, Status, Start and End Dates, Metadata Values and Metrics can also be shown.
By default, labels on single relationship lines show the Relationship Type. In earlier versions, if a line has more than one relationship, the number of relationships is shown (e.g. “5 Relationships"). In Version 10, if all the relationships are the same relationship type, the label says the number with the Relationship Type. There are also options to list the count of multiple relationship types, Start and End Dates, and Metadata Values.
Custom Entity and Relationship Type Properties
Entity Types can have custom properties. All entities of that type without its own custom properties, use the type’s custom properties. The same exists for Relationship Types.
Keep and hide entities based on their entity and relationship types. For instance, you may have telephone call data showing calls between phone numbers and the owner of each phone. Entity Replace lets you replace the phones with their owners to show the connection between the people rather than phones.
Specify the entity types to keep and replace. Advanced options let you choose multiple entity and relationship types to keep and hide. Settings can be saved for future use and multiple saved replacements can be combined.
Entity Replace acts like a filter. Once it is set, if you add new entities to your diagram, like Get Links, the replacement is applied to the new entities. Turn off the Entity Replace to see to all your entities again.
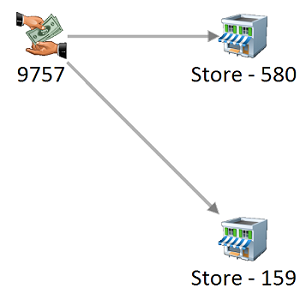
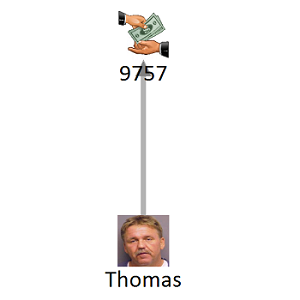
In the Visualizer diagram, Get Link is a powerful way to understand related data. Get Links, 1 Degree adds all the entities with relationships to an entity. There are two new options to just add links with relationships FROM or TO the entity. This is useful if you want to see flows like money in a particular direction.
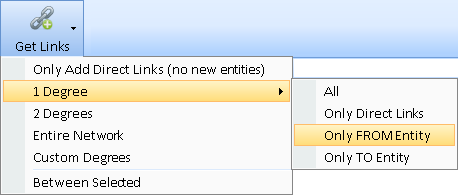 Get Links, 1 Degree with 4 Options
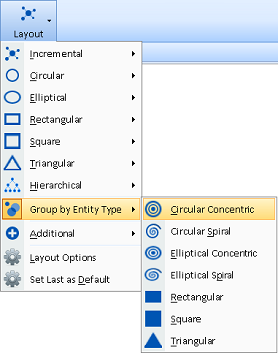
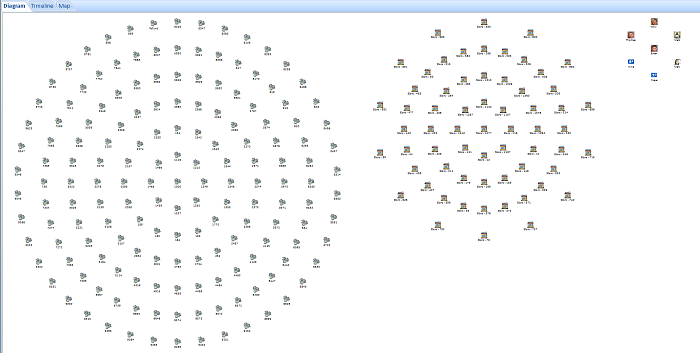
Layout automatically reorganizes the entities on the diagram. A new feature lets you easily see all the entities by entity type. Under Layout, a new [Group by Entity Type] item moves your entities into a variety of shapes for each entity type.
Each entity type is treated as a separate network arranged from largest to smallest, sorted by name within each type. For example, three entity types (transactions, stores, people) in concentric circles:
|
|
|
Easily select all the entities of a type to remove them or send them to a new Diagram (under Output).
The Visualizer’s Timeline tab has new toolbar options for Month View and Year View to better control the width of time periods.
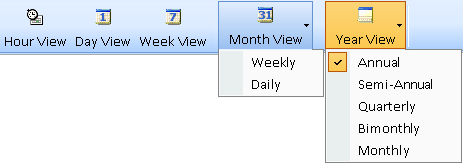 Timeline Date View Time Spans, Expanded
Month has a new Daily option which is wider than the weekly option. Year has new wider options for semiannual, quarterly, bimonthly, and monthly.
Set the earliest and latest dates of the view. Improved handling of items with missing Start and End dates.
When adding entities to the Visualizer diagram, the Add Items panel has a new [Show All Entity Types] checkbox to limit the icons to your most likely selections:
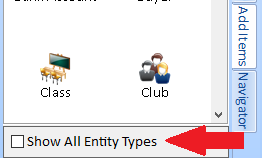 Add Items Panel with [Show All Entity Types] checkbox
Uncheck the box to only show the icons of entity types used by entities in your database. If checked, all the entity types in your lookup table (which may be large) are shown, which is the previous behavior.
A new [Refresh] button updates the data for the entities and relationships on the Visualizer. This appears on the far right of the toolbar with the Panels and Options buttons
 New Refresh and Panels Buttons
Refresh is helpful if you or someone else updates the database. Refresh retrieves the latest data such as entity name, type, image, properties, metadata, etc. and updates your screen accordingly. Any filters, gradients or replace settings are applied against the new data
The new [Panels] button toggles the right and bottom panels.
Previously, SNA metrics were calculated for networks with fewer than 10,000 entities. The limit is removed. It may take a while to calculate SNA metric, but it is no longer limited.
Search Enhancements
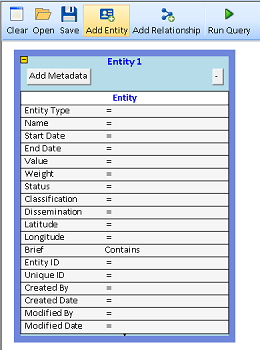 The Query Builder is revamped to be more powerful and easier to use.
More Advanced Queries
- Relationships can be searched on its own without entities.
- Relationships can have entity criteria on one or both sides of the relationship.
- Relationships can now search on Relationship ID, and like Entities, Created Date, Created By, Modified Date, Modified By, and Brief.
- Combine multiple, disconnected entity and relationship boxes as UNION queries.
- Search multiple values and wildcards on entity name and metadata values.
- Search for Blank and Not Blank values.
- Search for a metadata type (any value) or all metadata types with a specified value.
- Combine multiple, disconnected entity and relationship boxes as UNION queries.
- Perform multiple value and wildcard searches on entity name and metadata values.
- Search for a metadata type (any value) or all metadata types with a specific value.
Enhanced User Interface
- Adding a new Relationship automatically adds two entities.
- For Relationships, a new [Edit Links] button to reassign entity boxes, and optionally include or exclude TO/FROM entities.
- Lines between entities and relationships are thicker, at top instead of middle, and have arrows indicating TO/FROM direction.
- Criteria entries are validated for its column to be a date, number, integer, etc.
- Reordered columns for entities and relationship boxes for easier use and consistency.
- Collapse boxes to reduce their height to the last specified column value.
- Improved user interface for managing metadata criteria.
- Save and open retain the layout more accurately.
Query Results
- Each Run Query result is displayed on a separate form (instead of the bottom of the screen) so more data on a full screen can be shown and multiple results compared.
- Results form has text filter and options to send items to the Visualizer and Excel.
Searches for entities and relationships can be saved. Under Search, the new [Combine Multiple Searches] item lets you select and perform analysis among them.
Unlike saved Visualizer Diagrams which save specific items, saved searches are applied against your current database, so its results change with your data. Combine multiple filters to show their Entities and Relationships.
For instance, you may have saved a search for each crime scene selecting entities around a particular location and time. As your database is updated, each search retrieves new results. Wouldn’t it be interesting to find entities that appeared at all or most of the crime scenes?
After selecting the saved searches, choose the Common Data options:
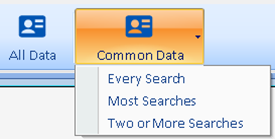
- Every Search: Find Entities and Relationships that are in every selected search. These are the highest value targets.
- Two or More Searches: Entities that are in at least two of the searches.
- Most Searches: Determine the maximum number of selected filters that an entity is found and show those. For instance, 10 filters are selected, but no Entities are in all 10. Sentinel Visualizer finds that the most filters an entity is in is 7, so it shows the entities (and relationships) that are in 7.
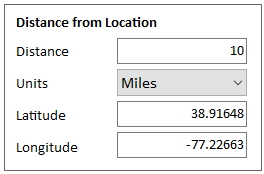
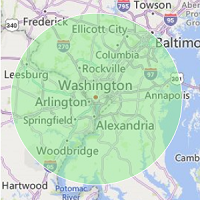
The entity search screen now lets you select entities based on its distance from a location.
|
|
|
Specify the distance in miles or kilometers, and the center point based on the latitude and longitude. All the entities in the circle are selected.
Entity and relationship metadata search for metadata is enhanced to find items with a metadata type regardless of value and wildcard searching on values.
All Items with a Metadata Type

For the entity and relationship metadata search, you can select a Metadata Type and leave the Value blank to find all the items that have that Metadata Type regardless of its value.
Previously, a value was required which did not support searching for any value for the type.
Metadata Wildcard Search
Wildcard searches support finding values that start with a letter(s), contain letters, and/or end with letters. The percent sign (%) is the wildcard character which symbolizes any characters. Use it find values that start, end or contain letters.
User Interface Enhancements
Home Page with images on MRU list and improved toolbar and left panel
Images on Most Recently Used (MRU) Entities and Relationships
When you select an entity or relationship to add to the Visualizer or view its details, it is added to the MRU list. The list is prominently displayed on the Home page and search forms to easily perform actions on your most frequently accessed items.
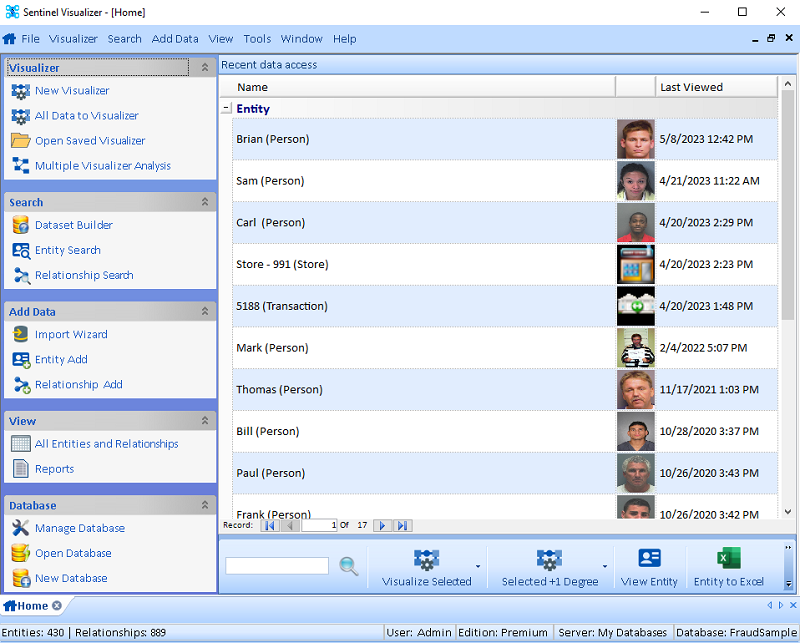
In version 10, a picture is displayed for each entity using its picture or its entity type icon. Relationships show the FROM and TO images of the entities in the relationship. This makes it easier to identify the entities and relationships.

Toolbar
The toolbar at the bottom lets you perform actions on your selected MRU items.

Type a few letters in the new filter feature to reduce the MRU list by their names.
 Visualize Selected
- [Visualize Selected] sends the selected items to the Visualizer.
- If you select more than one entity, there is an option to also include the relationships between them.
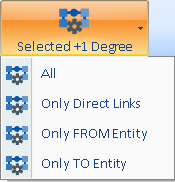 Selected + 1 Degree
[Selected + 1 Degree] lets you send the selected items to the Visualizer and add their connections to other entities (one degree links). Includes the new Directional links.
- [All] adds all linked entities plus links among the linked entities.
- [Only Direct Links] only adds the linked entities without links among them.
- [Only FROM Entity] only adds entities with relationships FROM the selected entities.
- [Only TO Entity] only adds the entities with relationships TO the selected entities.
The top menu is reorganized to match left border of the Home Page:
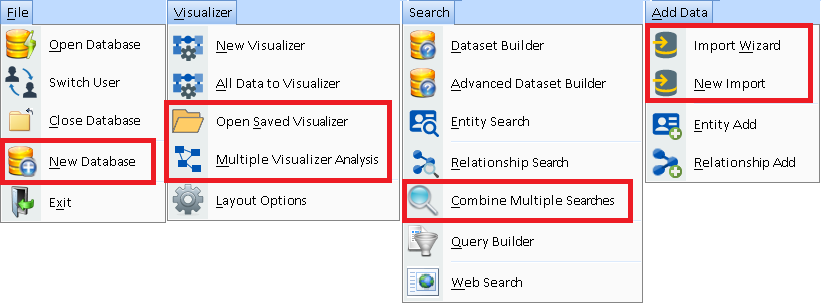

Menu Changes
- File: [New Database] combines [New Local Database] and [New Shared Database] into one.
- Visualizer:
- NEW [Open Saved Visualizer] opens a saved diagram without opening the Visualizer first.
- NEW [Multiple Visualizer Analysis] combines and compares multiple saved diagrams.
- Search: NEW [Combine Multiple Searches] selects multiple saved entity and relationship searches to show all or only common items among them.
- Add Data: NEW [Import Wizard] simplifies creating a new import with a Wizard.
- View (replaces Reports): Several new items to view lists of entities and relationships without using the dataset builder.
- Help: NEW [Check for Update] to see if you are running the latest version of the program.
Home Page Panel
On the Home Page, the left panel reflects similar changes:
- New buttons include [Open a Saved Visualizer], [Multiple Visualizer Analysis], and view [All Entities and Relationships].
- [New Database] combines separate items for local and shared databases.
- Each section can be minimized by clicking the icon in their top right corner.
A new collection of 9,500+ high resolution images are included for your use on Entity Types and individual entities.
![]() High Resolution Icon File Library
High Resolution Icon File Library
The new icons are 128x128 pixel PNG files and replace a much smaller collection of 32-pixel ICO files. For new databases, the default list of Entity Types has the higher resolution graphics.
The Visualizer diagram and other forms support the higher resolution graphics for a richer and more visually appealing appearance.
 In addition to the Home Page, a search box makes it easy to filter the records in several grids by typing in a few letters.
Quickly and visually search on Entity Name, Type, etc. to reduce the displayed list.
This exists on the Home Page, entity and relationship search pages, dataset builder results, query builder results, lookup table management, import preview, and other forms.
Under Tools, Manage Database, you can set the values of the Lookup tables. Lookup tables are lists of values for some entity and relationship fields such as type, classification, dissemination, credibility, reliability, users, topics, etc.
Previously, each lookup value was added one at a time. For most of the lookups, you can now enter multiple values at once. Multiple values can be added by entering them separated by commas or semicolons, or as rows (pasted from Excel). If there are other values like Weight or Description, they are applied to each of the new items

 Custom Entity Properties
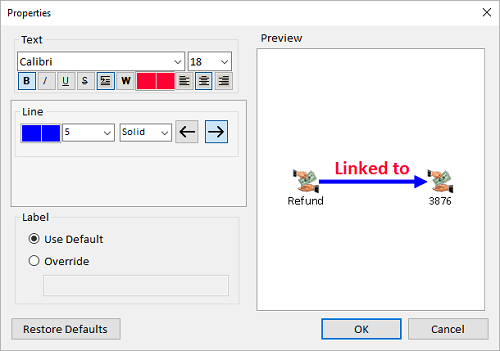 Custom Relationship Line Properties
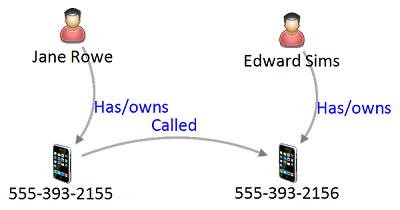


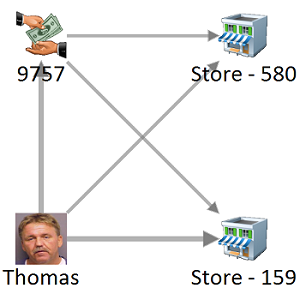
 Relationship Lines with Style as a Curve
 Relationship Lines with Style as a Line
 Geo-Query a Circle around a Central Point

