Geospatial Analysis with Online Maps and Google Earth Integration
Free TrialSentinel Visualizer provides complete support for Geospatial Analysis and Visualization. Geospatial tools are directly integrated into the product, removing the need for separate installations or software licenses.
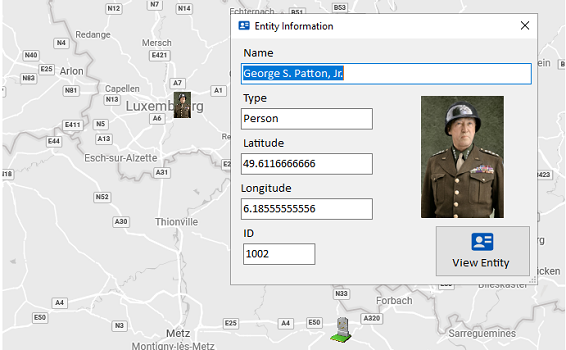
Any entities on your diagram with latitude and longitude are automatically plotted on the Map. This makes it easy to see where your entities are located and adds a whole new way to understand your data.
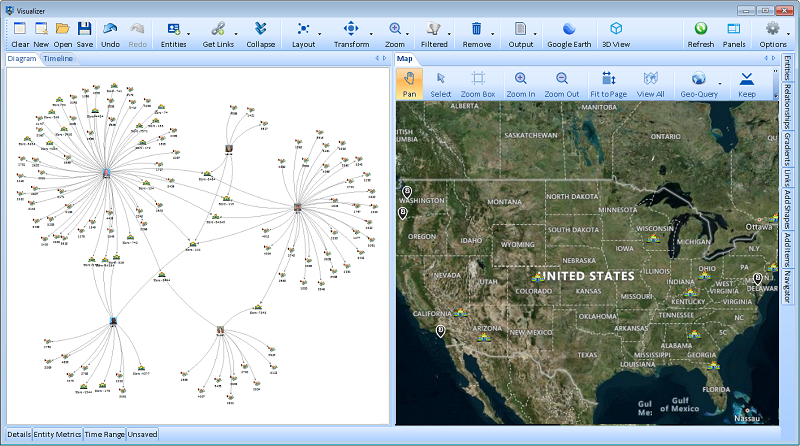 Visualizer with Map Tab Dragged to Right to Show it Side-by-Side with the Diagram Tab
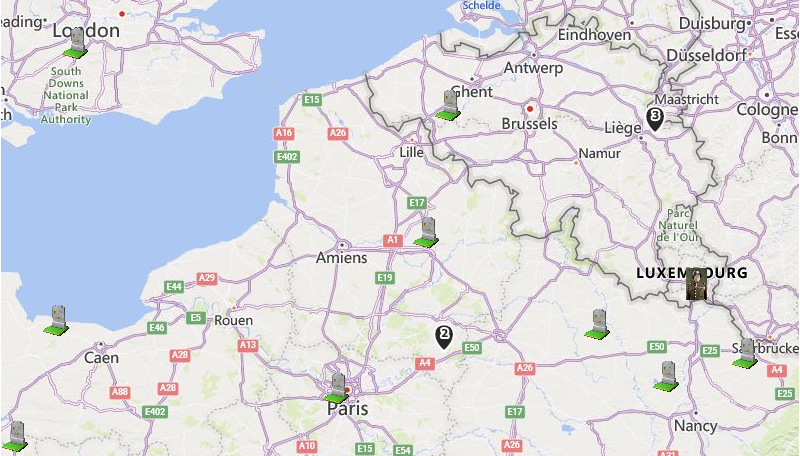 Individual Icons with Numbered Pins showing Multiple Entities

- Pan to drag the map surface
- Select to draw a box or click on entities
- Zoom Box to draw a box and adjust the map to that size.
- Zoom in and out of your map.
- Fit to Page automatically adjusts the map to the smallest size to show all your items.
- View All to see the whole world.
- Geo-Query to draw a circle or rectangle to add the entities in that region.
- Keep to retain the selected entities and remove the others.
- Remove to delete the selected entities.
- Style for map options.
- Output options for the map and data.
 Toggle Navigation Panel on the Map
 Google and other data sources, such as cell phone towers and license plate readers, offer lists of devices, vehicles, and suspects around a specific location and time period.
Known as geofencing, data for a specific geographical area and time period may be retrieved for analysis. This is particularly helpful for law enforcement when people commit crimes while carrying a cellphone that can be used as a tracking device.
Sentinel Visualizer can import and analyze geofence data to quickly identify common devices across multiple crime scenes. These high priority suspects demand your attention.
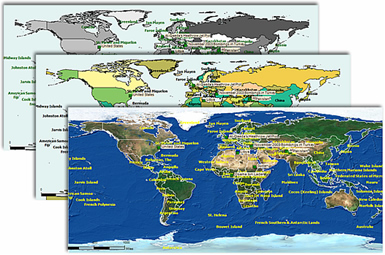
Sentinel Visualizer also provides and supports offline maps using your own geospatial resources. If you have ESRI ArcGIS, ShapeFiles, or GeoTIFF files, you can add those layers directly into your Sentinel Visualizer maps.
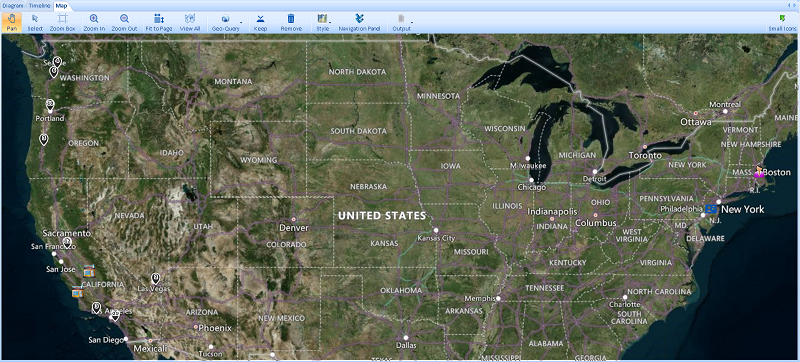 Online Map Hybrid Style (Borders and Topography)
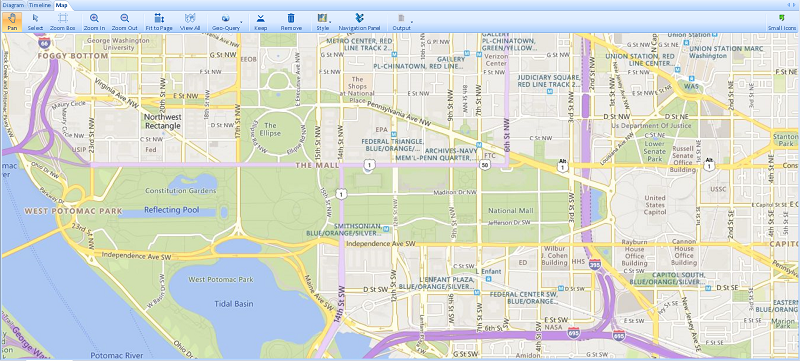 Road Style
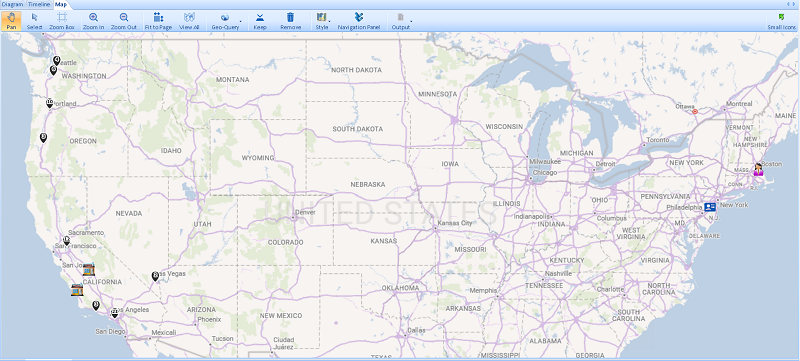 Road Light Style
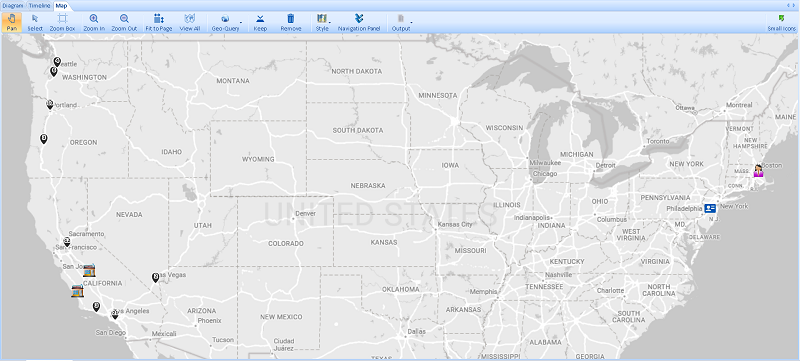 Road Gray Style
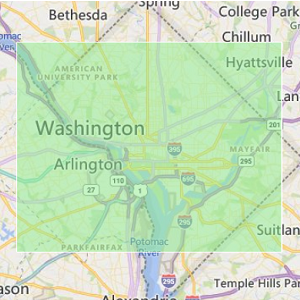 Rectangle Geo-Query
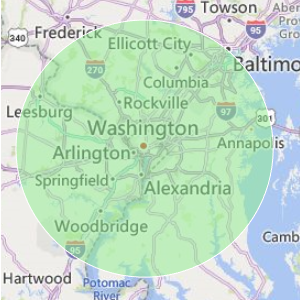 Circular Geo-Query
