Telephone Call Records: All Paths Analysis
Free TrialBackground
Telephone call data records contain a list of phone calls, people, which phone numbers they own, and a list of target telephone numbers. To create the database:
- We imported the call data records into Sentinel Visualizer’s database.
- We imported the targeted phone numbers.
For more information on this database, watch: Telephone Call Data Record Video
Objective
There are lots of phone calls. Do the targeted phone numbers have calls that connect them through intermediaries? If so, we want the family of associated phones to investigate further.
Sentinel Visualizer Analysis
Here are some steps to explore the power and features of Sentinel Visualizer to show and transform the layout and perform the analysis.
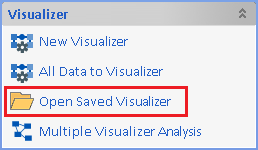
After opening the database, from Sentinel Visualizer's Home Page, click [Open Saved Visualizer].
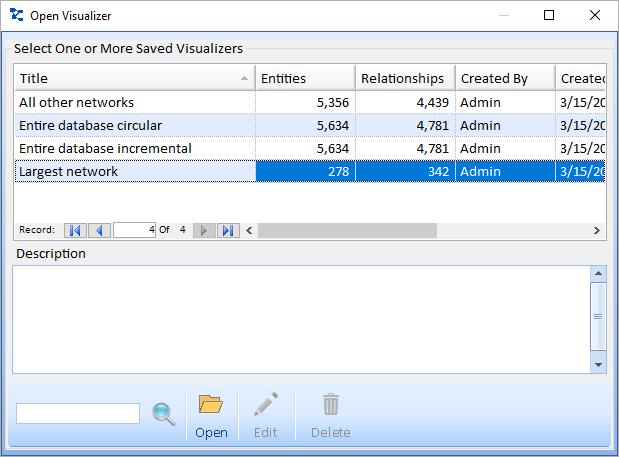
Select the diagram titled Largest Network and click the [Open] button.
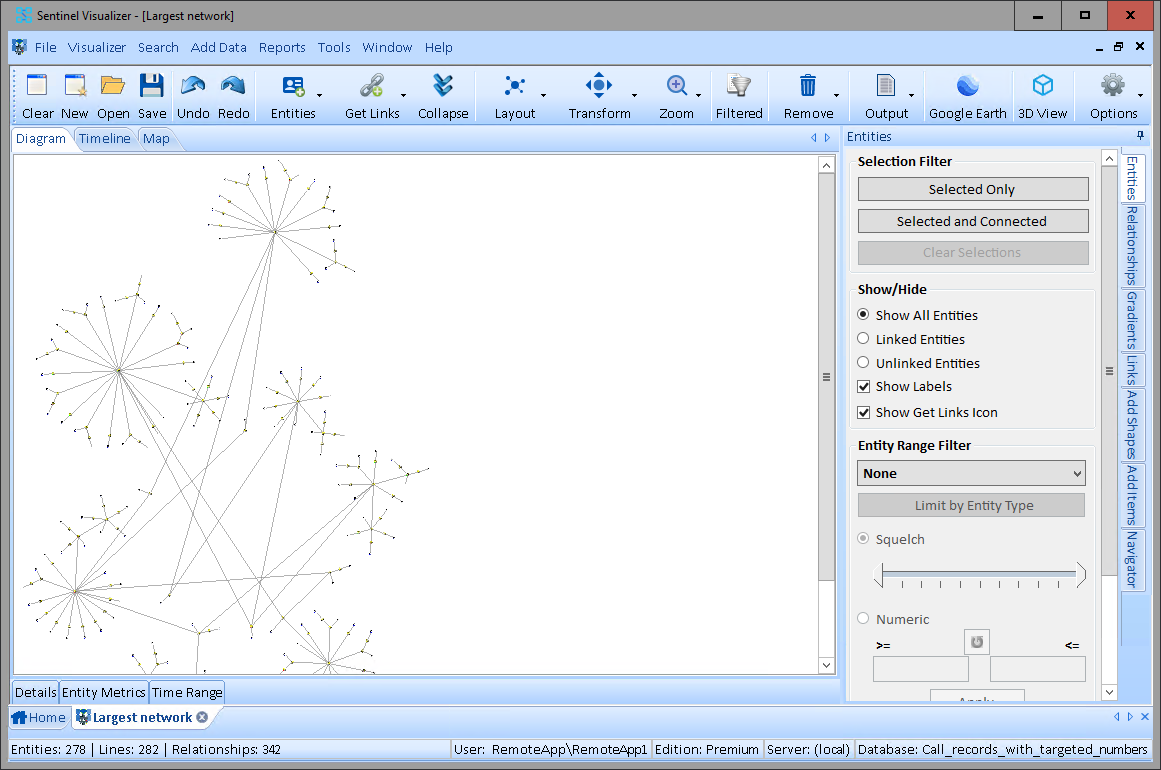
This is an example network (a subset of the entire database) that was discovered within the ~4,000 rows of call records (Excel spreadsheet).
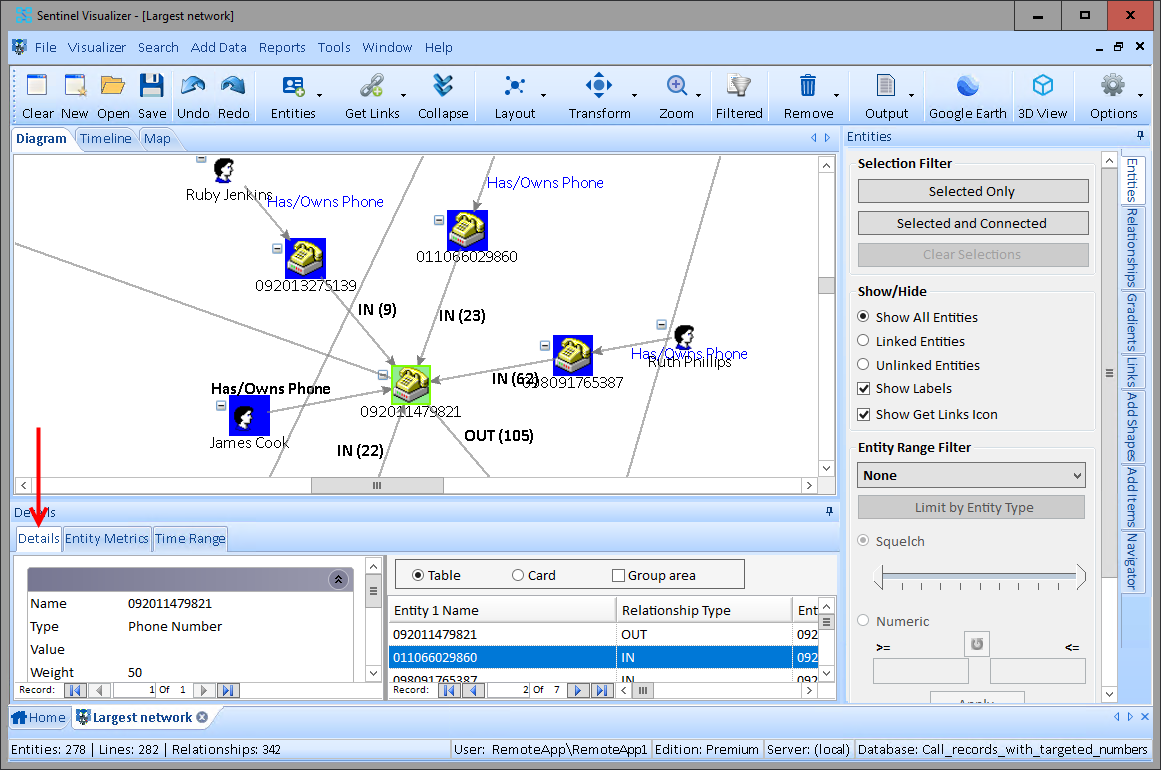
Explore the network. You can zoom-in (Ctrl + Mouse Scroll Button up) to see phone and people are connected to each other.
As you click on phone numbers and relationships, they are highlighted green. The connected entities are highlighted in blue. You can customize the colors under Options. Details of the selected items appear in the bottom window pane, on the [Details] tab.
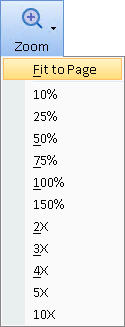
To view the entire network on the screen, select the [Zoom] button from the toolbar and select [Fit to Page].
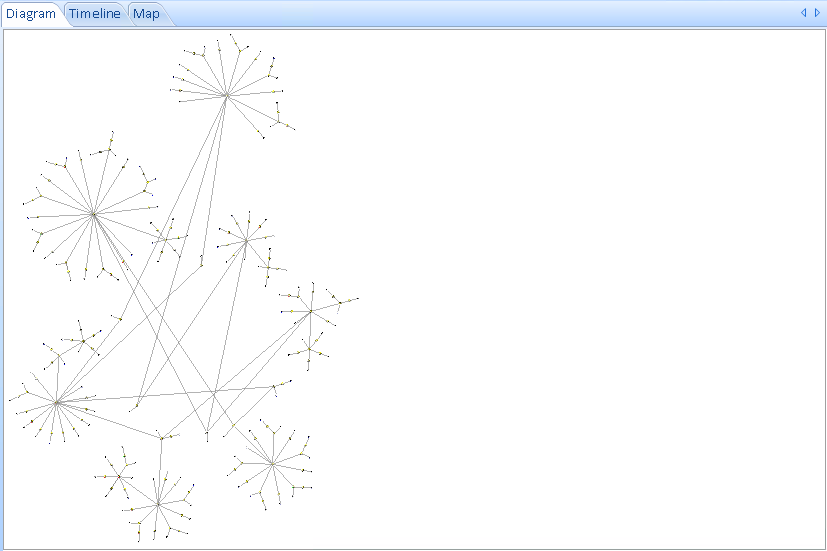
To rotate the diagram to better fit your screen, click the [Transform] button on the toolbar and select [Rotate Right 90°].
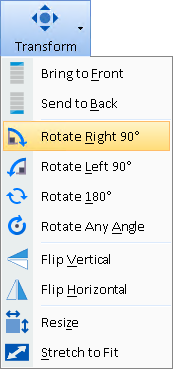
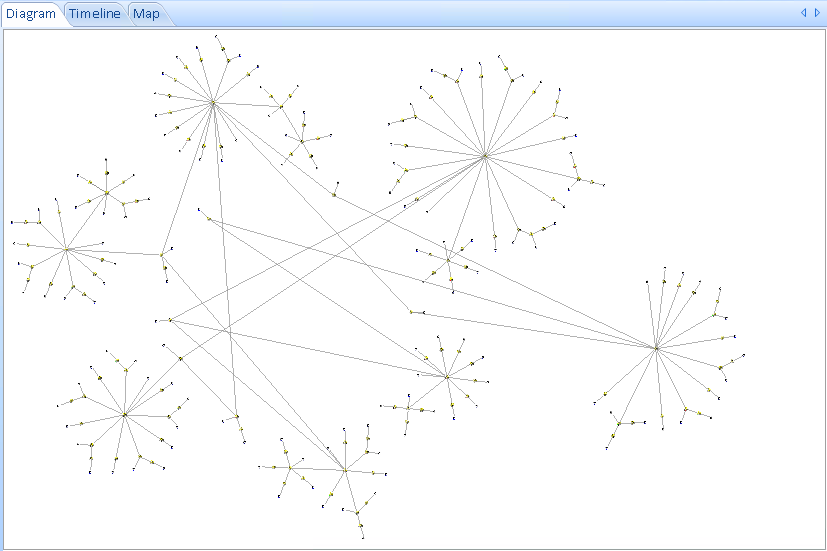
[Stretch to Fit] can be used to adjust the diagram to fit the dimensions of your window.
The database identifies Targeted phone numbers with a metadata value. Select them with the Data Refinement feature and pressing the [Select Filtered] button.
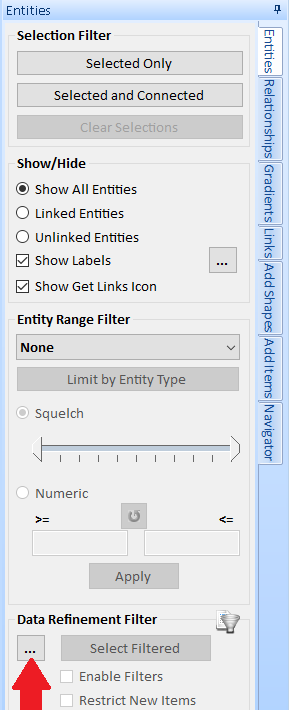
- On the right panel, Entities tab, go to the Date Refinement Filter section, and click the [...] button to open the Entity Filter window.
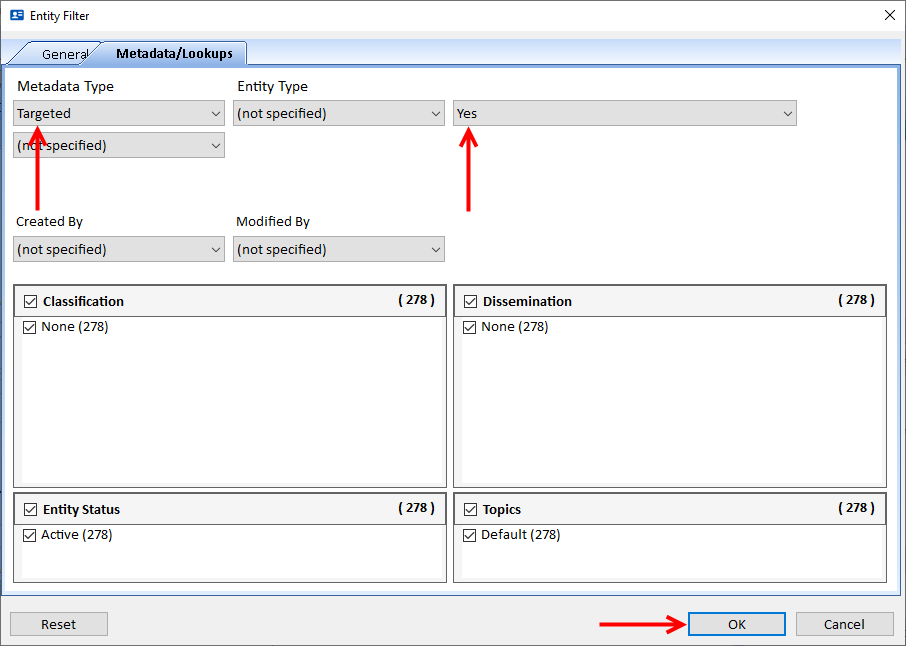
- Click the [Metadata/Lookups] tab.
- In the Metadata Type drop-down, choose Targeted. In the Entity Type drop-down, choose Yes then click [OK].
Click the [Select Filtered] button in the Data Refinement Filter section to select them. The diagram shows the highlighted targeted phones in Green.
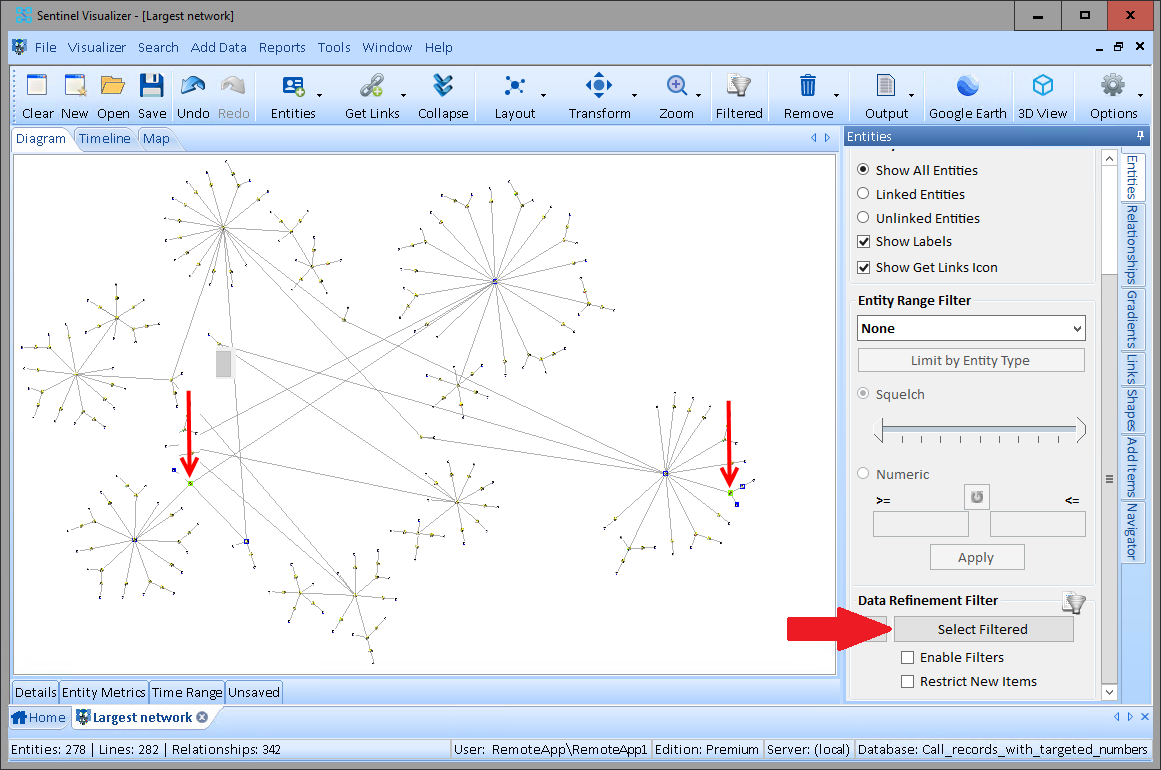
Note: If you check Enable Filters, only the Targeted entities would remain visible.
On the far right side of the visualizer, click the [Links] tab.
Select the [All Paths] radio button. The lines that connect those two targeted phones are highlighted in red. This illustrates the paths between the two targeted phones.
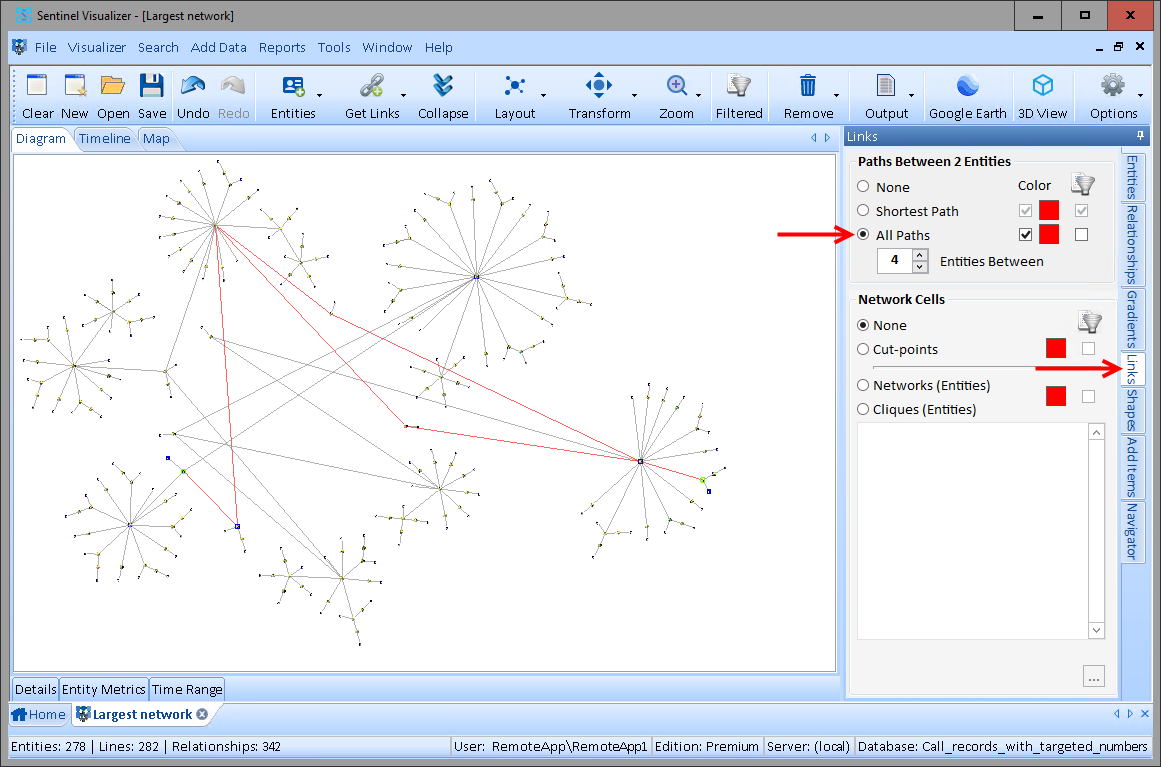
To view only the paths connected to the two targeted phones, check the box under the Filter icon.
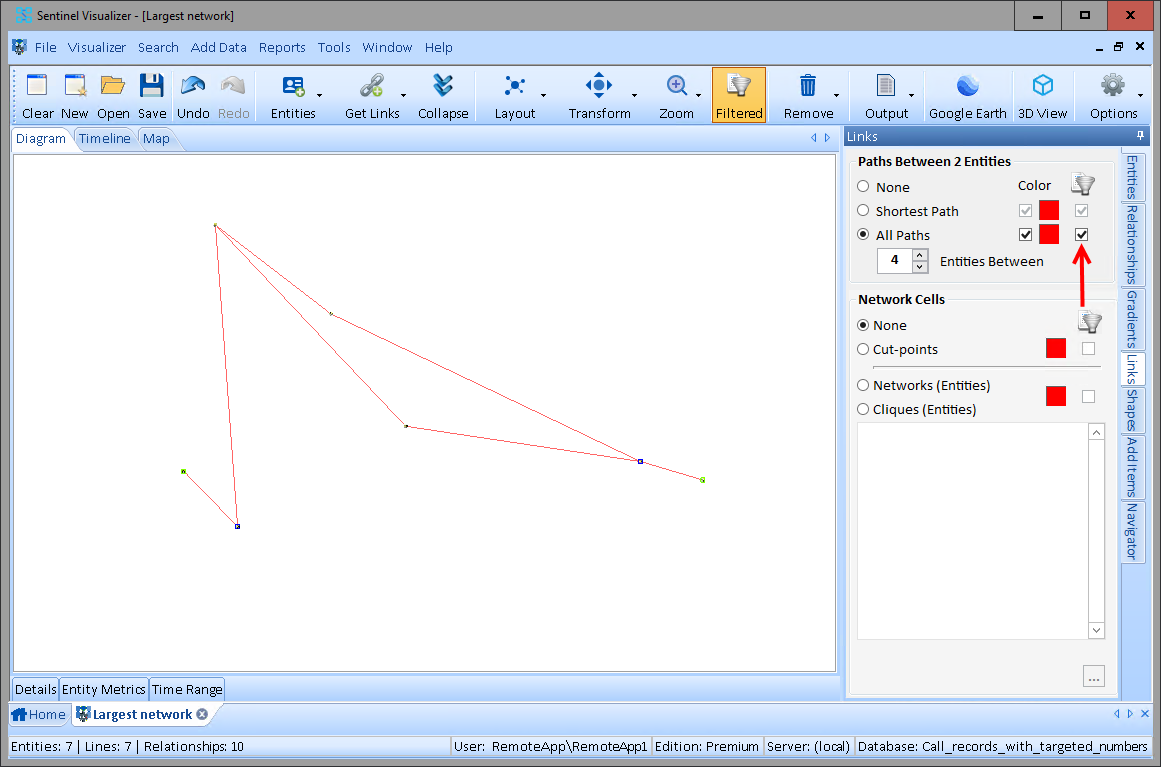
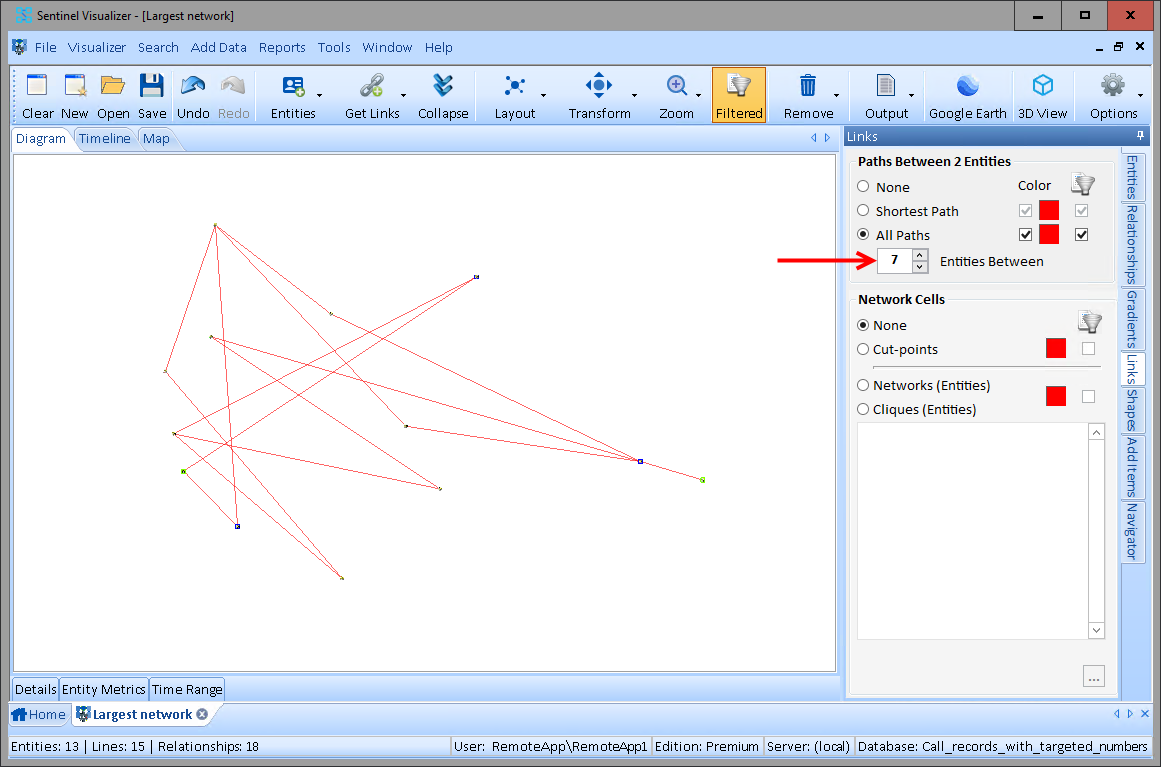
To see more paths that are linked to the two targeted phone numbers, change the number of Entities Between by clicking the up arrow.
Sentinel Visualizer offers a variety of automated layout functions that make it easy to quickly organize networks into different configurations. Visit Sentinel Visualizer's Layout Options for more information.
Click the [Layout] drop-down on the visualizer toolbar. Select [Elliptical] and click [One Ellipse].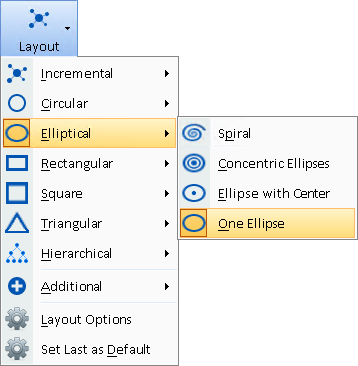
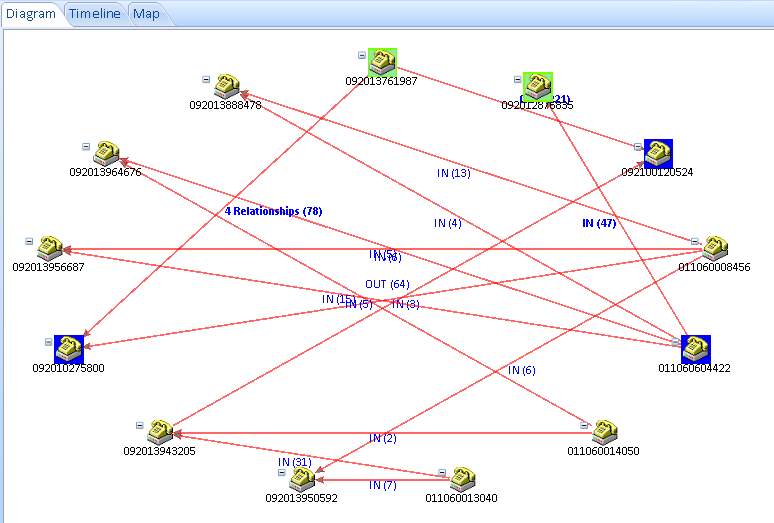
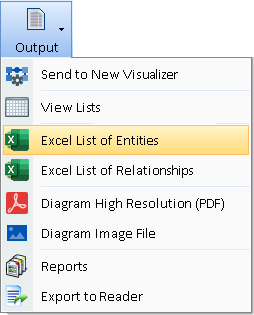
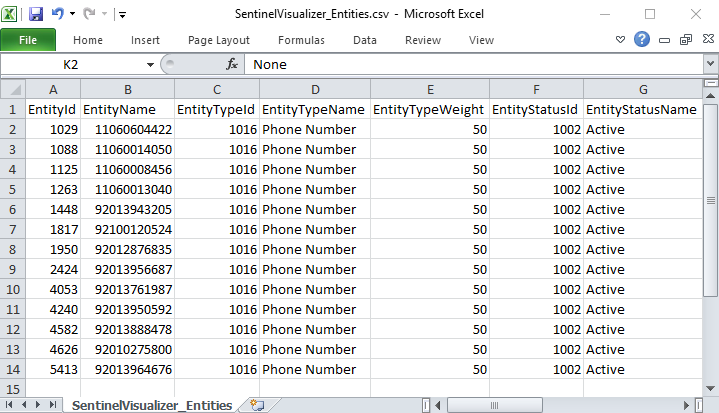
Export the list of entities on your diagram into an Excel spreadsheet by clicking [Output] on the visualizer toolbar and selecting [Excel List of Entities].
In some cases, an investigation may not be allowed to search an entire database (fishing expeditions).
However, if there are pre-defined targeted phone numbers, identifying the family of connected entities among them may be justified for additional research.
Sentinel Visualizer makes it easy to quickly identify and prioritize these high value targets, while protecting the privacy of others.

