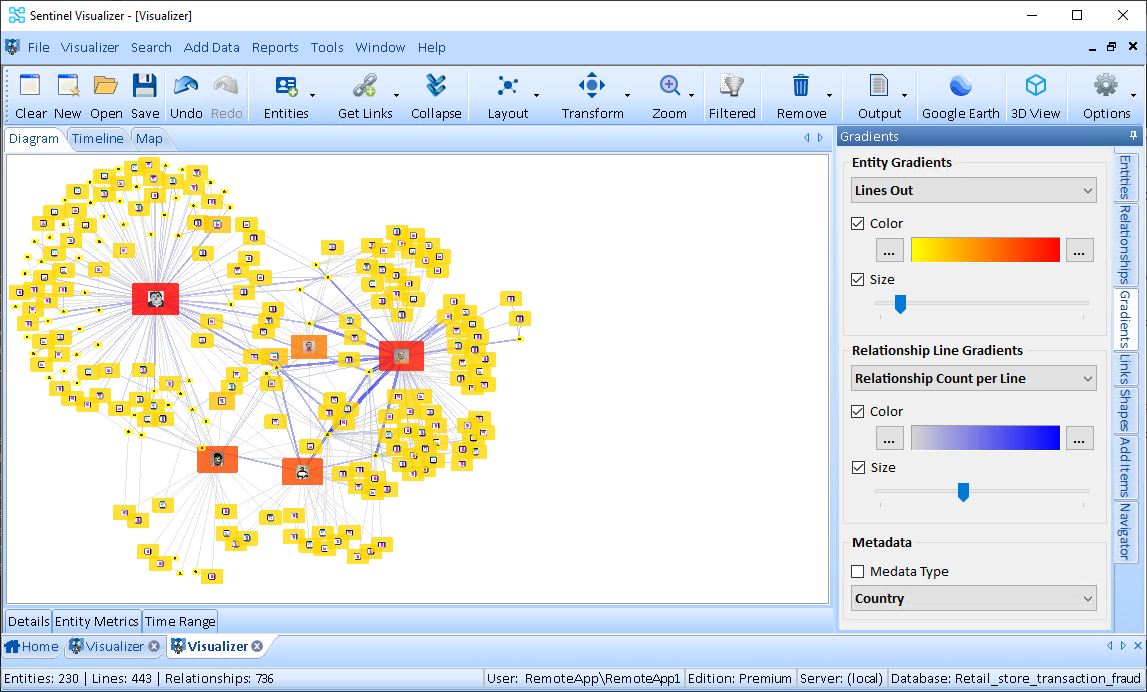
Retail Store Database with Gift Card Transactions Fraud
Free TrialBackground
A retailer with multiple store locations suspects fraudulent activity among users of its gift cards and merchandise returns. A large database of transactions exists for purchases and returns, and most are valid, but is there organized criminal activity?
Objective
Perform transaction analysis to detect suspects committing retail fraud.
Sentinel Visualizer Analysis
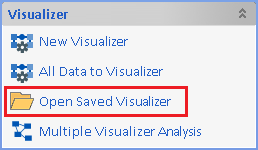
After opening the database, from Sentinel Visualizer's Home Page, click [Open Saved Visualizer].
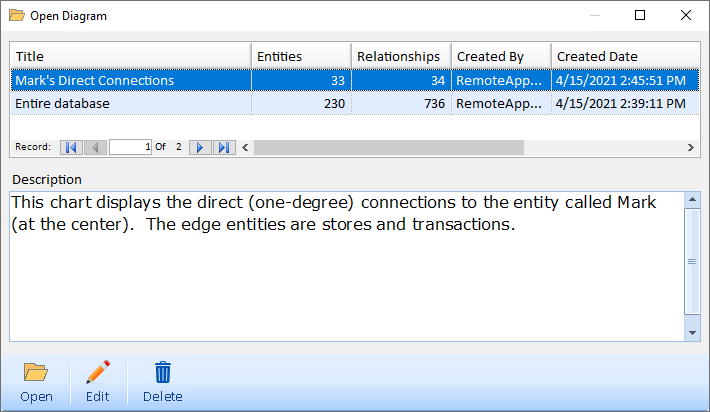
Select the diagram titled "Mark's Direct Connections" and click the [Open] button.
This is a saved diagram that displays the direct connections between Mark and other entities (in this case, stores and transactions).
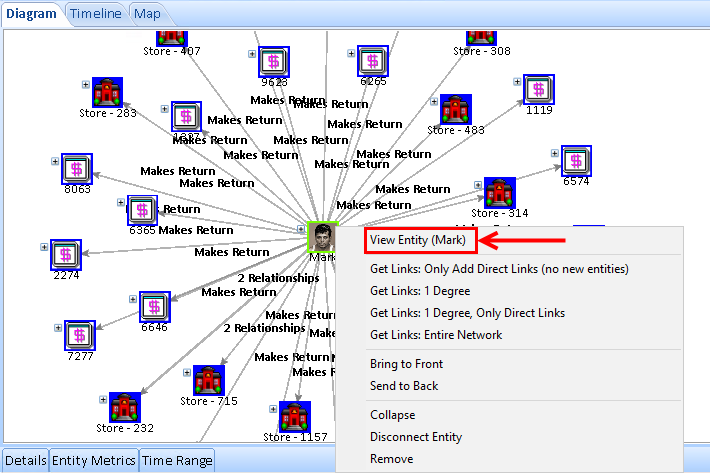
Right-click on Mark's picture and choose "View Entity (Mark)". Note the different tabs behind which information is held.
The documents tab can contain pictures, videos, websites and more.
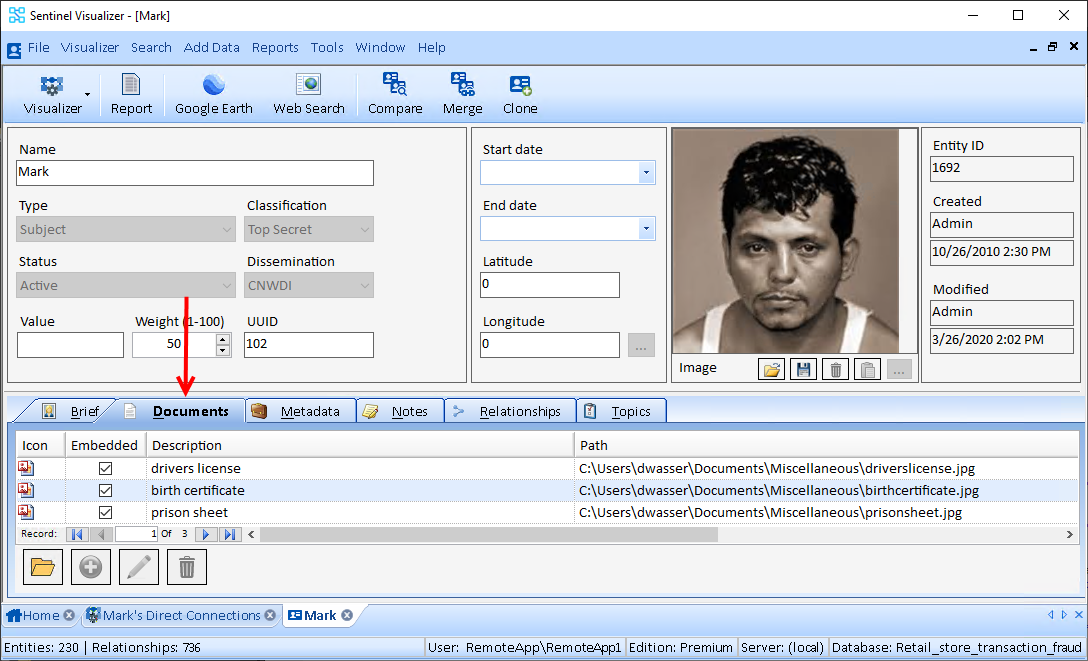
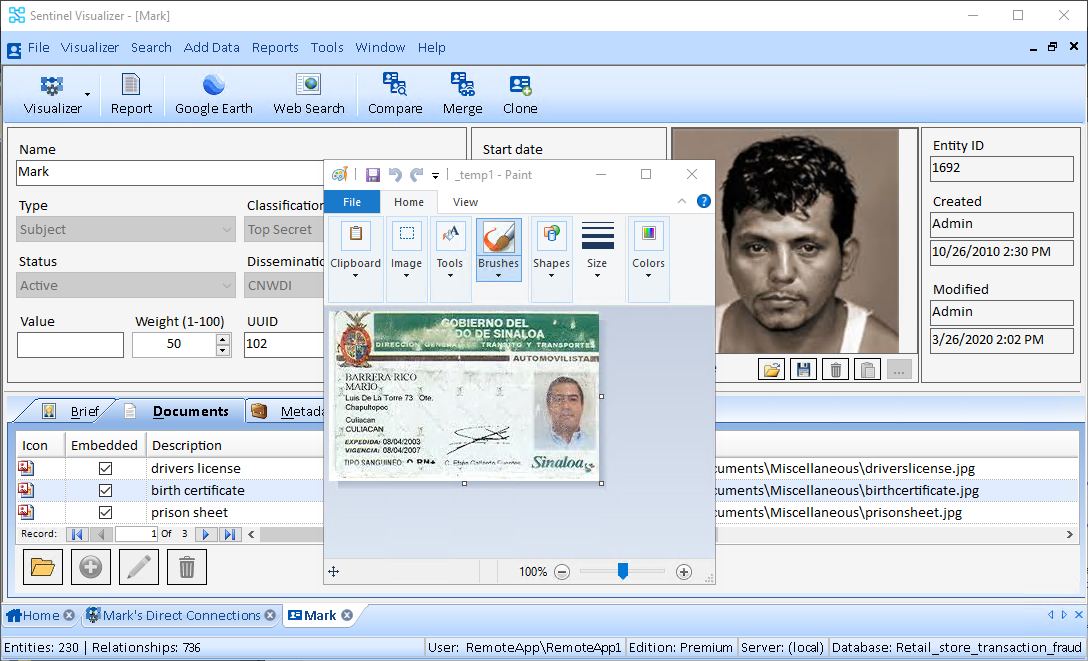
Double-click on one of the documents to display it. (With a real license, you would be able to edit this record. The trial, though, is view-only and does not allow editing.)
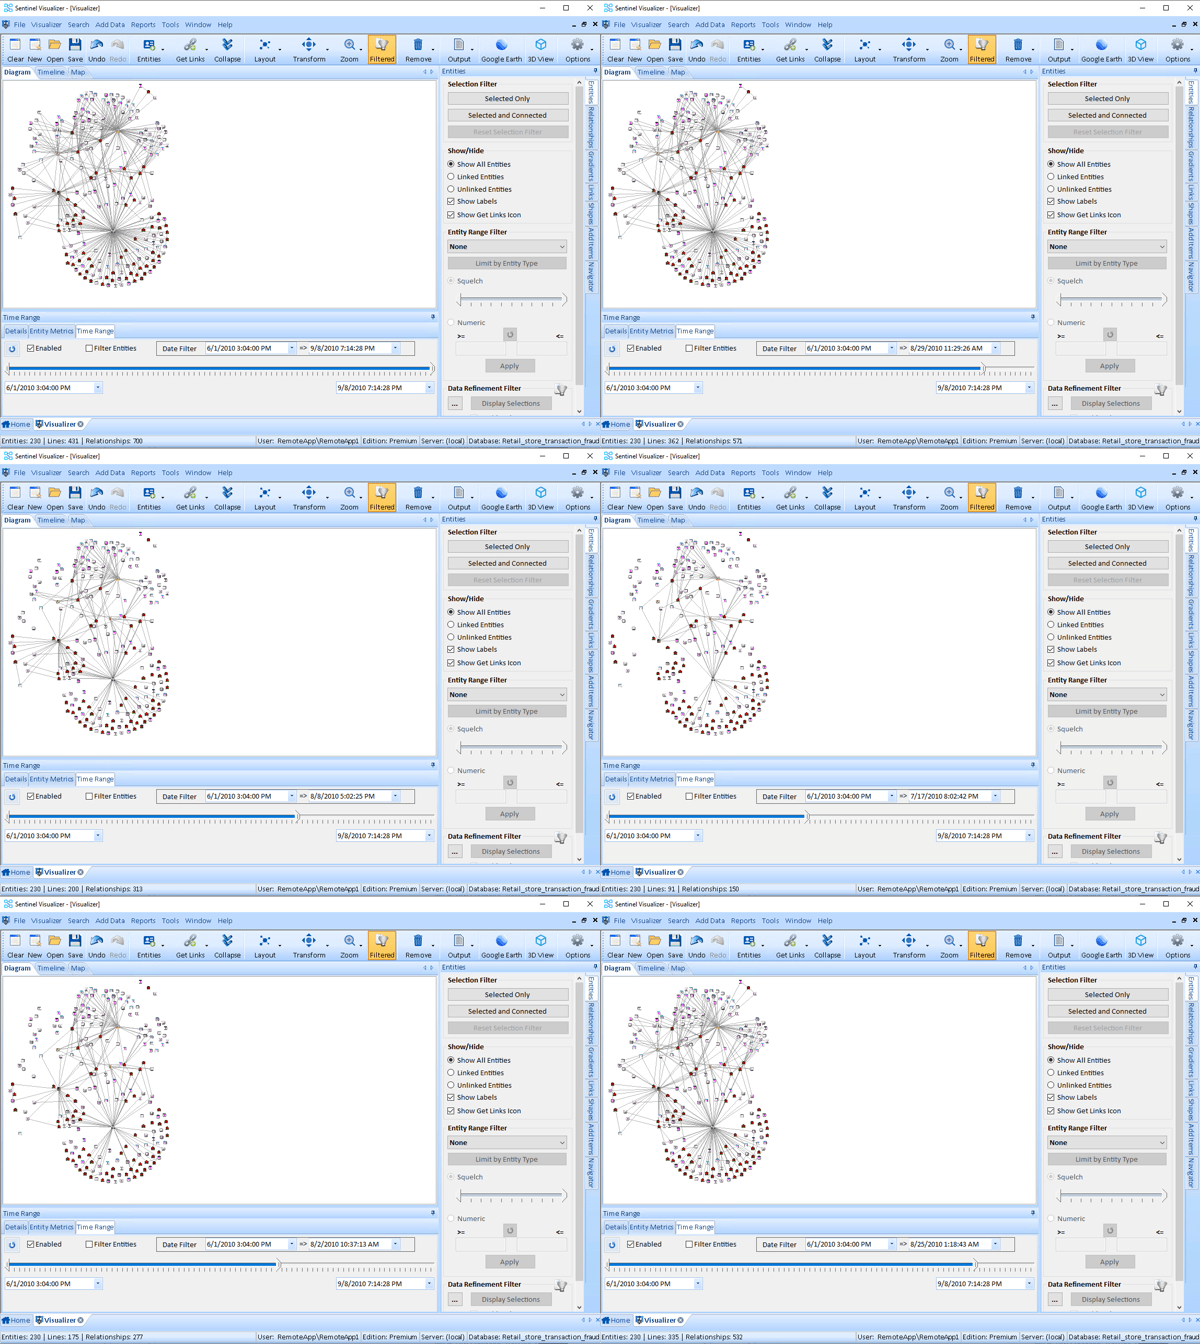
To view Temporal (time) analysis, go to the Home Page (lower-left tab) and click [All To Visualizer].

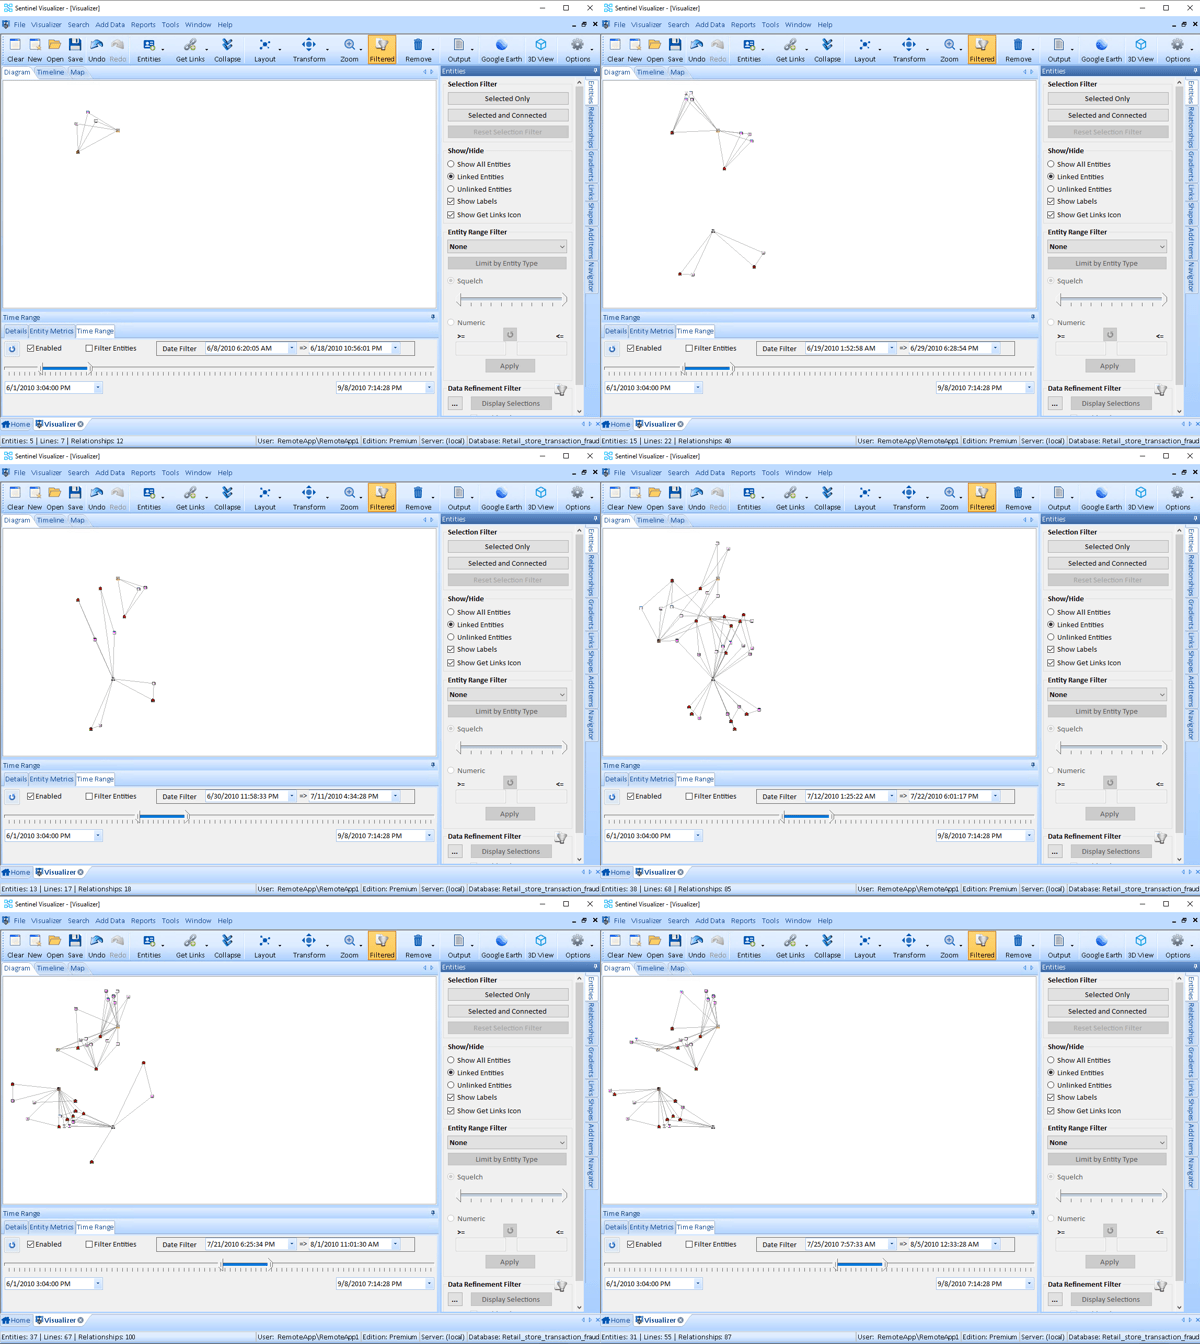
Click the Time Range tab in the lower part of the window and then check the [Enabled] box.

Slide the right and/or left slider back and forth to see the network expand or contract.
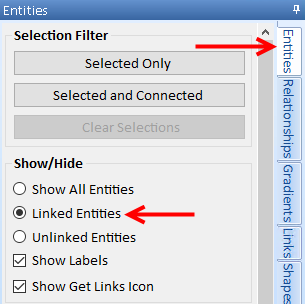
To display only the connected entities, click on the [Entities] tab and select the [Linked Entities] radio button.
In the Time Range section, "grab" the blue lines and slide it back and forth for a rolling window of time.
In the vertical tabs on the far right side of the visualizer, click the [Gradients] tab and try some of the Metrics in the pull-down combo boxes (Entity Gradients and Relationships Line Gradients).
